

Powerful animation with transitions and game loops combined
Check this out!
It's a donut chart that transitions to a bar chart. Same component, same React code, different radius. 29,905px instead of 728px. 🤯
I actually got the idea from that flat earth documentary on Netflix. Behind the Curve. No joke.
Why do flat earth people believe the earth is flat?
It's because the curve is soooooooo big that it looks flat.
That gave me an idea for a client project. They asked me to build a smooth transition from a donut-shaped visualization to a bar chart shape.
No idea how to do that so I stalled for weeks by building everything else first. Until one day I had an idea
I just discovered a new approach to React + D3 transitions 🤯 Of course this happens juuuust when I think React for Data Visualization is complete
— Swizec Teller (@Swizec) March 5, 2019
Check this out, it combines the "game loop via state changes" with the "D3 runs transitions" approach pic.twitter.com/mMglR4hDwp
You can combine the two approaches to animation you learned in React for Data Visualization. We talked about
The game loop approach. Borrows ideas from the gaming industry. Call
this.setState60 times per second and your React component animates. Wonderful.The D3 transition approach. You take a React component, use props as a staging area, render from state, and use
componentDidMountoruseEffectto hand over rendering control to D3. D3 runs its transition, manipulates the DOM, then gives control back to React.
A new approach to complex transitions
Now there's a 3rd approach. Something I never thought of before and it works great.
Let's look at the transition again
Here's what happens behind the scenes to make it work:
- A
<Donut>component renders a bunch of<Arc>s - Each
<Arc>takes care of its complex shape. Built from 3 different D3 arc generators - The whole thing is driven by D3's pie generator. It calculates start and end angles for individual arcs
- Donut size is a function of radius. The bigger the radius, the bigger the donut.
- As the radius increases from 728 to 29,905 the donut grows
- And it moves down as fast as it grows. Without moving, it would fly off the screen and you'd never see it again
- To keep the pie exactly 728px wide even though it's rendered on a 29,905px donut ... well you gotta calculate the arc segment and derive start and end angles from that
🤯
That's a lot of stuff.
And it's all driven by this code. The transition 👇
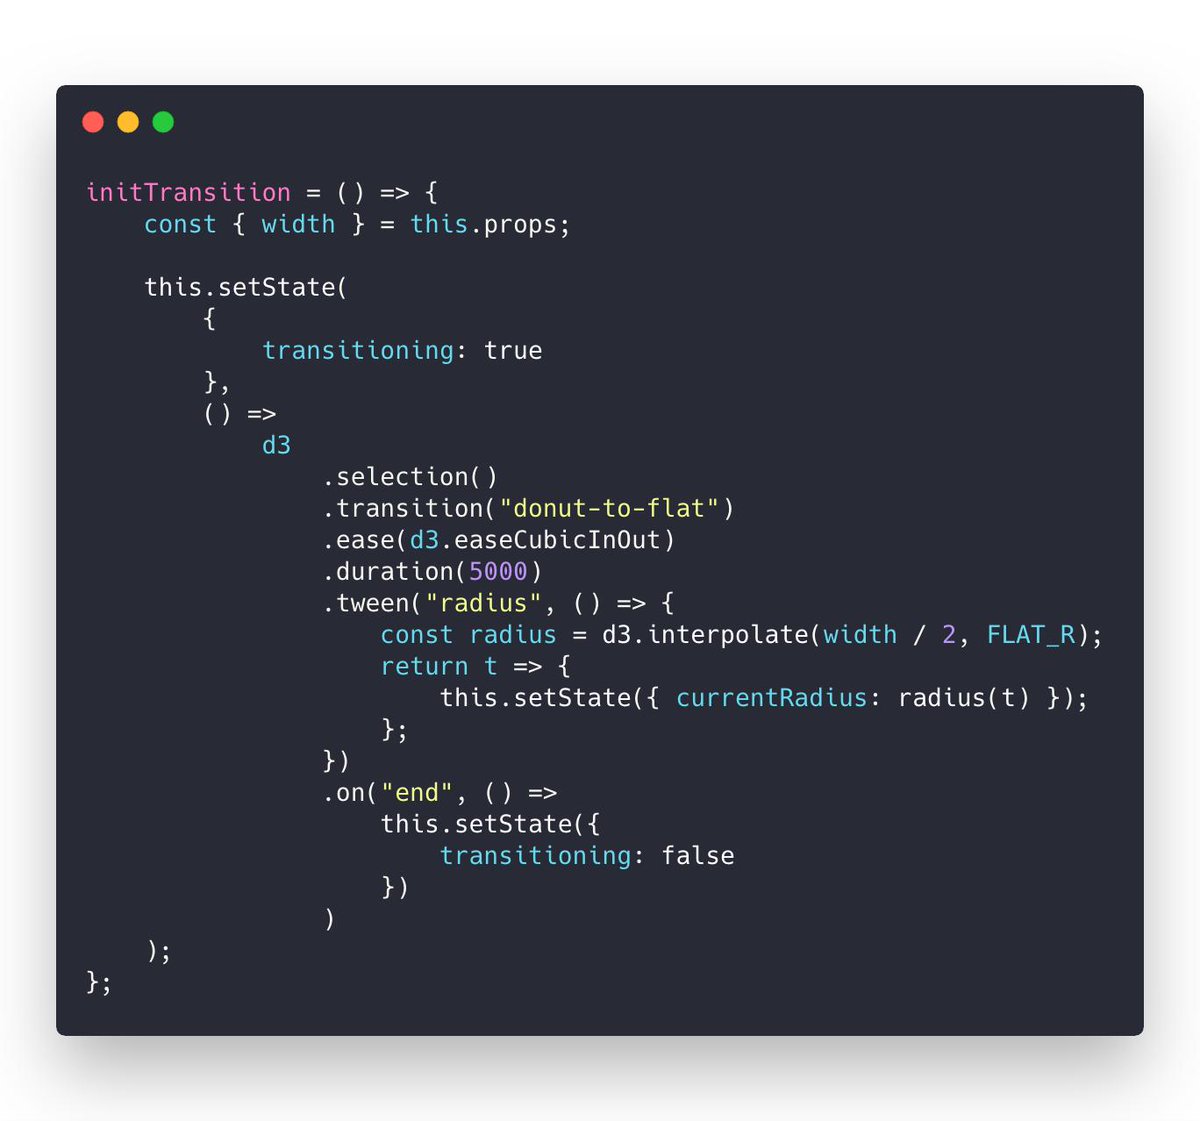
I call this on component mount. Could be on a click event or whatever. Starts a custom tween transition with D3.
That lets D3 control the timing, the easing functions, keeping it smooth, all of that. You don't have to think about any of it.
But instead of changing a DOM attribute, my tween calls this.setState on the
React component. Meaning it's changing React state instead.

Since the donut bar chart knows how to render itself based on a radius ... well ... you can keep re-rendering at various radiuses and It Just Works.
Smooth transition by re-rendering the whole visualization 60 times per second. Even though it's a super complex component. Lots of moving parts and subcomponents.
Knowing everything that's going on behind the scenes I am blown away by how well it works.
React is magic.
But first you should understand custom tweens. They're the under-the-hood part of this magic.
This next section was recorded before hooks. The underlying technique remains the same. We'll do hooks in an exercise at the end of this chapter :)
Understanding custom tweens
Transitions like we used above work using interpolators. For numbers, an interpolator is easy: A function that parametrizes changes to a single argument.
let i = d3.interpolateNumber(10, 20)i(0.0) // 10i(0.2) // 12i(0.5) // 15i(1.0) // 20
D3 can interpolate everything from numbers, to colors, and even objects or
strings. It does so by finding interpolatable parts of your argument and
manipulating them linearly depending on the t parameter.
But sometimes you need custom interpolators – tweens.
Say you want to animate an arc shape. The path definition argument is a complex string 👇
M100.6434055594246,-99.8203632756589A8,8,0,0,1,112.2823856114007,-99.46188154973098A150,150,0,0,1,-104.56274177607584,107.54828233063364A8,8,0,0,1,-104.38099615277264,95.90520136696549L-64.39381262786019,59.38549403963366A8,8,0,0,1,-53.635344263429694,59.35696964757701A80,80,0,0,0,61.78081312913049,-50.82451307295977A8,8,0,0,1,62.30830828934212,-61.57007978883599Z
If that doesn't make sense, don't worry. I can't read it either.
When you transition a shape like that, funny things can happen. Sometimes arcs fly around the screen, sometimes you get an error.
Notice the arc wobble.
Tweens to the rescue
Luckily, D3 lets us define custom transitions called tweens. To smoothly
animate a piechart we can build an arcTween. Because piecharts are made of
arcs.
The idea is to move from transitioning path definitions, to transitioning angles on a pie slice. We build a tween generator that takes some params and returns a tweening function.
Tweening functions lie behind all transitions. They take an argument, t, and
return the value of your prop at a specific "time" of your transition. All
transitions you've used so far are built with tweens in the background.
![]()
Our tween generator is going to need:
oldData, the definition of our pie slice at the start of the transitionnewData, the definition of our pie slice that we want to tween towardsarc, a D3 arc generator
Both oldData and newData come from a
D3 pie generator.
The startAngle and endAngle is what we're interested in.
Our arcTween function uses these to build a tween method that we then feed
into attrTween.
// inspired from http://bl.ocks.org/mbostock/5100636function arcTween(oldData, newData, arc) {const copy = { ...oldData }return function () {const interpolateStartAngle = d3.interpolate(oldData.startAngle,newData.startAngle),interpolateEndAngle = d3.interpolate(oldData.endAngle, newData.endAngle)return function (t) {copy.startAngle = interpolateStartAngle(t)copy.endAngle = interpolateEndAngle(t)return arc(copy)}}}
We make a copy of oldData so we don't change input data by accident, then
we return a function. This function creates two interpolators with
d3.interpolate. One for each angle.
Each interpolator starts from an oldData angle and moves towards a newData
angle.
This function then returns our interpolation function. It takes the argument
t, feeds it into our two interpolators, adjusts values on the copy object,
feeds that into the arc generator, and returns a new path definition.
You use it like this 👇
// Arc.jsd3.select(this.refs.elem).transition().duration(80).attrTween("d", arcTween(this.state.d, newProps.d, this.arc)).on("end", () =>this.setState({d: newProps.d,pathD: this.arc(newProps.d),}))
Select an element, a <path>, start a transition, make it last 80
milliseconds, attrTween the path definition, d, attribute using the tween
returned from arcTween.
A practical example
Here's an example of how you might use that in an animated piechart. Same idea works for any custom transition you want to build.
Use tweens to drive state – hybrid animation
You now have all the ingredients for hybrid animation:
- Custom tweens for tight transition control
- State changes to drive animation
Let's bring them together ✌️
Red squares in a circle. Click one, they all fly out – bouncing like they're tied to an elastic. Click again and the circle contracts.
Silly example, sure, but a useful technique. Same way the piechart to bar chart transition worked.
It all happens in the <HybridExample /> component.
<HybridExample width={500} height={500} x={250} y={250} />
Hybrid example is a functional component based on React Hooks. We use state for
the radius, an angleScale to position rectangles, and an explode function
to trigger the transition.
const HybridExample = ({ x, y }) => {const [radius, setRadius] = useState(10);const N = 10;const angleScale = d3.scaleLinear().domain([0, N]).range([0, Math.PI * 2]);const explode = () => {// transition};return (<g transform={`translate(${x}, ${y})`} onClick={explode}>{d3.range(N).map(i => (<Squarex={Math.cos(angleScale(i)) * radius}y={Math.sin(angleScale(i)) * radius}key={i}/>))}</g>);
useState hook gives us initial radius of 10 and a setRadius function to
change it. angleScale translates linearly between a domain of 0 to N, and
angles in radians. 0 is 0, 2PI is a full circle.
We render squares the usual way:
- grouping element for positioning
- loop over a range of size
N <Square />for each iteration- use trigonometry to translate angles to
xandycoordinates
Here's a helpful image, if you've forgotten your high school maths like I have

Tween-driven state changes for animation
We used onClick={explode} to trigger the animation. Here's what that looks
like
const explode = () => {const elastic = d3.easeElasticOutelastic.amplitude(5)elastic.period(-0.3)d3.selection().transition("radius-boom").ease(elastic).duration(1000).tween("radius", () => {const radiusInt = d3.interpolate(radius, radius > 10 ? 10 : 60)return (t) => setRadius(radiusInt(t))})}
explode starts by creating a new easing function – elastic. Elastic easing
is built into D3 and you can tweak its amplitude and period. Try different
values to see what happens.
We start a new virtual d3.selection(). Doesn't select anything, lets us run a
transition. Gotta give it a name though – radius-boom.
Then we specify the easing function, the duration, and create a custom tween.
.tween("radius", () => {const radiusInt = d3.interpolate(radius, radius > 10 ? 10 : 60);return t => setRadius(radiusInt(t));});
Our tween operates on the radius, which isn't even an SVG property. That's
just a logical name we use.
The tween itself uses an interpolator that goes from current radius – that's
the state – to either 10 or 60. Small or large. That way we can use the
same tween both for growing and shrinking the circle.
We return a parametrized function that takes a t parameter and calls
setRadius with a value from our interpolator.
setRadius is the set state function we defined earlier with useState, which
means we update state on every tick of the transition animation. Update state,
component re-renders, you get smooth animation.
Works great ✌️

A bouncy scatterplot exercise
Time for an exercise, with hooks this time :)
Take your scatterplot from a few chapters ago and change the click handling function to resize the scatterplot using hybrid animation. Give it a little bounce.
You can use mine:
Once you gave that a shot, check my solution below.
My solution
The key difference is this part here:
function resize() {d3.selection().transition().duration(2000).ease(d3.easeBounceOut).tween("dimensions", () => {const width = d3.interpolate(dimensions.width, 0)const height = d3.interpolate(dimensions.height, 0)return (t) => {setDimensions({width: width(t),height: height(t),})}})}