

Stop copy pasting D3 examples, create data visualizations of your own
Learn how to build scalable dataviz components your whole team can understand with React for Data Visualization.
So you want to build a beautiful data viz. You've got data burning a hole through your pocket, an idea for a juicy story, and your boss or client are waiting for results.
You want something that looks great, works in the browser, performs on mobile, lets users interact with their data, syncs across an entire dashboard, and works as building blocks for future projects.
Cool ... now what?
I remember building my first data visualization back in 2012. Visualized my coding habits from GitHub data.

I was so proud! Only took me a week. 💪
Try a free chapter
See what React for Data Visualization is like and learn some basics.

"I've tried D3 in the past, found it powerful but a bit confusing to use"
Dynamic data visualization for the web is a pain in the ass you see. Harder than it looks.
Yeah sure anyone can build a chart in google docs but that's not what you're after is it? You can't build a product on top of google sheets. You definitely can't feed in dynamic data from an API, personalized to the user, and let them navigate and explore.
You've heard people build these amazing things with D3. The New York Times uses it, The Guardian does, so do Netflix, Uber, 23andMe, Visa, Walmart, and many others. I know because they've been to my workshops ;)
You hunt the web for examples and omaigod what is this!? How the hell is D3 doing that? 😳😳

That's a bar chart by the way. You'd never guess just looking at the code. I've been doing this for years and I still have to simulate D3 examples in my mind to figure out how they work.
You decide that's too much and look for a library. Something easy you can use to finish real quick.
You find a bunch of libraries built on top of D3. Some even combine React and D3. Perfect for any modern web project!
You cobble something together and call it a day. Job well done.
Try a free chapter
See what React for Data Visualization is like and learn some basics.
Libraries are hard to customize
Your boss takes one look and says "Ok but can you make it follow our style guide?"
Errr ...
Okay okay, some CSS, a little trickery, tweak the arguments and you got dis. Crisis averted!
"I don't like how this animation looks"
"Can we tweak that margin?"
"Make those bars taller"
"Add a line chart and I want tooltips to show up on all 5 charts when I mouse over the same data point"
Now you're in trouble buster.
You used a library and those always break down when you start customizing stuff. At some point you spend more time fighting the library than building your data visualization.
Time to learn D3.
"There are way too many shitty resources on D3 floating around on the interwebs, and frankly, the D3 docs are shit too because they're WAY TOO COMPLICATED AND VERBOSE for someone that just wants to understand how it works and get shit done."
You can do what everyone else does: Copy paste some examples that look like what you're building, make some tweaks, and hope for the best.
You're not proud of your code and you're not quite sure how it works, but it works and that's what matters. Right?
Yep that works until you have to change something. Or explain how it works to another engineer on your team so they can fix a bug.
God forbid you come back 6 months later looking to fix a thing or add a feature. Time to re-study all of that code and figure out how it works.
ugh
94+ Full HD videos
Watching code appear before your eyes makes it easier to understand.
"without it I'm stuck using stack overflow in a disjointed, incorrect mess"
You can avoid all that and learn how to build scalable and reusable dataviz components your whole team and future you can understand with React for Data Visualization.
Get the confidence you need to excel and build anything you can imagine. 💪
React is the biggest revolution in JavaScript programming since jQuery hit the scene 10 years ago, and D3 is unlike anything you've seen before.
The problem comes from how most of us first learn to code. "It's like a cooking recipe", teachers will say.
Take a bell pepper and cut it up. Then sprinkle some salt and pepper, add olive oil, and voila: you have a refreshing salad. A very simple salad with a single ingredient, but a salad nonetheless. You can follow along and eventually you will understand what the code does.
That's imperative programming. It reads as a series of steps. How to do something.
React and D3 are declarative. You don't write How you want your code to work, you write What you want to achieve. Your bell pepper salad recipe looks more like this:
<Salad><Oil /><BellPepper cut salted /></Salad>
You look at that and you know it's a salad. It involves oil and bell peppers. You don't have to read the steps to know the result. The recipe declares what it's making.
Declarative code makes your project cleaner and easier to maintain. Means more time creating value for your users and clients.
But learning how to think declaratively is hard. It starts like voodoo magic. We've all been there. It still hurts my brain sometimes.
That's why React for Data Visualization starts with small building blocks then builds up to entire dashboards. Learn the basics in about an hour, then dive as deep as you want
Why use React and D3 for data visualization
I believe React combined with D3 is the best thing that's ever happened to data visualization on the web.
React's approach to components makes your code more reusable, its advanced algorithms make it fast, and D3 has the best tools for dataviz. Together they represent two of the most popular JavaScript libraries on the web.
Watch some of my conference talks for a sneak peek 👇
The talk shows a proof of concept approach to making fancy animations with React and d3js - a Space Invaders game. I explain the basic approach, where I got the idea, and show off some code.
This talk is more hands on. I show how the animated alphabet, particle generator, and talk about the benefits of componentization when it comes to building modern data visualization.
You don't have to watch the whole talk, it's all in React for Data Visualization.
A Learn with Jason episode where in just an hour we built an animated scatterplot from scratch and proved React-based D3 visualization works great with Gatsby. The dataviz rendered statically at build time.
React for Data Visualization is designed for busy people like you

React for Data Visualization gives you a quick overview of the basics to get you started, followed by a deep dive that solidifies your knowledge through varied projects and examples. Build working code that you can show off to your friends, boss, and coworkers.
Learn the basics with interactive examples right in your browser — no need to install anything. Forget about Npm and Webpack and Babel and Node. Just React and D3.
Dive into complex projects that teach you how it all fits together. Build interactive visualizations, create animations, and build fast performance with canvas. Learn everything there is to know about building beautiful apps with React and D3.
From the very basics of React and D3, to state handling with Redux and MobX, React alternatives like Preact and Inferno.
And the best part?
It's all cut into bite sized pieces. Whether you've got 5 minutes or an hour, you can get through this course. That's a promise.
Start with the building blocks

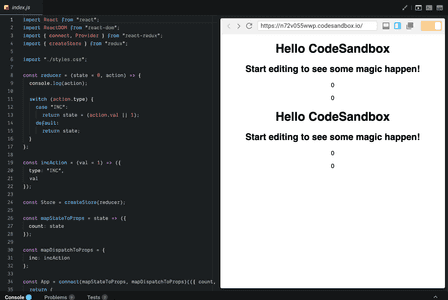
1.) Start with the basics. Right in your browser.
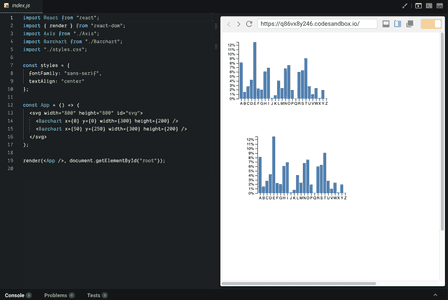
2.) Learn about blackbox rendering with a reusable axis component. Teaches you all about giving up control, using higher order componnents, and more. You can use this approach to render *anything* inside your React app. Even Vue.
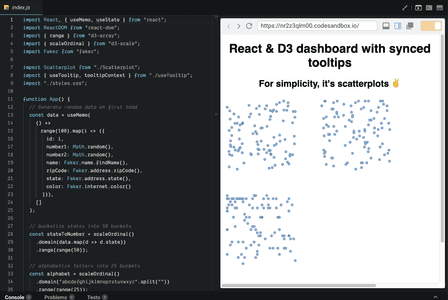
3.) Learn full integration rendering with a scatterplot. Use the axis from before, add a bunch of data, then go as far as usinng render props to make your scatterplot shine.

4.) Both times youre learning how to make your components reusable. Plug-and-play buildign blocks for your team.
5.) Jump into animation with game loops where you learn about havign full control, how to think in frames andn movement. Youll be suprrised how powerful this can be.

6.) When full animation is too much, youll need transitions. Learn about keyframes and easing functions and makign your animation look antural and smooth.
React for Data Visualization builds on practical examples
A piechart transitions to a barchart
Shows you how to use hybrid animation for data-driven effects. Even transitioning between different visualization types.
An interactive choropleth map
Shows you how to work with topographical data, draw maps, and census regions. We implement zooming and map exploration.
An interactive histogram
Teaches you some of D3's statistical functions, and the basics of drawing charts. Drawing shapes, adding axes, parsing data ...
Interactive dashboard
Together they form an interactive dashboard where multiple charts share data, react to common controls, and act together to give users a full picture.
A swipe transition
A swipe transition teaches you about building transition-based animation. Flip a boolean, see complex animation.
An animated alphabet
An animated alphabet teaches you about creating enter/update/exit transitions. Animate elements coming in and out of your data visualization.
A particle generator
A particle generator teaches you the basics of using Redux for state management, pushing your browser to the limits, and animating tens of thousands of elements.
An interactive billiards game
An interactive billiards game teaches you about rendering graphical React components onto HTML5 canvas, making them interactive, and using MobX for state handling.
A dancing pythagorean tree fractal
A dancing pythagorean tree fractal teaches you about component recursion. We use it to compare differences between React, Preact, and Inferno.
Table of Contents
▶ Introduction (14:22)
▶ A quick intro to D3 (17:15)
▶ How React makes D3 easier (11:46)
▶ Quickly integrate any D3 code in your React project with Blackbox Components (17:29)
▶ Build scalable dataviz components with full integration (24:02)
▶ You're awesome
▶ A note about state and app structure (2:59)
▶ Set up a local environment with create-react-app (1:53)
▶ 176,113 tech salaries visualized – a dataviz dashboard (2:54)
▶ Show a Preloader (6:47)
▶ Load and parse your data (8:26)
▶ Render a choropleth map of the US (20:14)
▶ Render a Histogram of salaries (22:57)
▶ Make it understandable with meta info (20:47)
▶ Add user controls for exploration (18:46)
▶ Make it work in the real world (4:56)
▶ Animation (2:06)
▶ A bouncy ball game loop animation example (6:46)
▶ Use transitions for simple animation (0:27)
▶ Build a swipe transition component (7:58)
▶ Enter-update-exit animation
▶ Animating with React, Redux, and D3
▶ Speed optimizations
▶ Using canvas
▶ Smooth animation with 20,000+ elements
▶ Build a small interactive canvas game
▶ Speedy React Alternatives
▶ Refactor your components with React Hooks (35:42)
▶ Powerful animation with transitions and game loops combined (20:56)
▶ You finished! 🚀
▶ Cookbook: Various visualizations and how to build them
How React makes D3 easier
Quick React+D3 integration
Scalable dataviz components with full integration
3 extra projects you can use as a cookbook
Monthly livestream of a real dataviz project
Money-back guarantee
Yours forever
FULL COURSE
+ 1on1 call
D3 the good parts
How React makes D3 easier
Quick React+D3 integration
Scalable dataviz components with full integration
React, D3, and hooks
Detailed walkthrough of a large dataviz dashboard project
Game loop animation
Animating with transitions
Hybrid animation for complex interactions
Enter/update/exit animation
Redux and MobX basics
Rendering to Canvas
Refactoring to React Hooks
All extra projects you can use as a cookbook
Monthly livestream of a real dataviz project
Money-back guarantee
Yours forever
D3 the good parts
How React makes D3 easier
Quick React+D3 integration
Scalable dataviz components with full integration
React, D3, and hooks
Detailed walkthrough of a large dataviz dashboard project
Game loop animation
Animating with transitions
Hybrid animation for complex interactions
Enter/update/exit animation
Redux and MobX basics
Rendering to Canvas
Refactoring to React Hooks
14 extra projects you can use as a cookbook
Monthly livestream of a real dataviz project
Money-back guarantee
Yours forever
Try a free chapter
See what React for Data Visualization is like and learn some basics.
About the Author

Hi, I’m Swizec Teller. I help coders become software engineers.
Story time 👇
React+D3 started as a bet in April 2015. A friend wanted to learn React and challenged me to publish a book. A month later React+D3 launched with 79 pages of hard earned knowledge.
In April 2016 it became React+D3 ES6. 117 pages and growing beyond a single big project it was a huge success. I kept going, started live streaming, and publishing videos on YouTube.
In 2017, after 10 months of work, React + D3v4 became the best book I'd ever written. At 249 pages, many examples, and code to play with it was designed like a step-by-step course. But I felt something was missing.
So in late 2018 I rebuilt the entire thing as — a proper video course. Designed for busy people with real lives like you. Over 8 hours of video material, split into chunks no longer than 5 minutes, a bunch of new chapters, and techniques I discovered along the way.
React for Data Visualization is the best way to learn how to build scalable dataviz components your whole team can understand.
Some of my work has been featured in 👇


94+ Full HD videos
Watching code appear before your eyes makes it easier to understand.
How React makes D3 easier
Quick React+D3 integration
Scalable dataviz components with full integration
3 extra projects you can use as a cookbook
Monthly livestream of a real dataviz project
Money-back guarantee
Yours forever
FULL COURSE
+ 1on1 call
D3 the good parts
How React makes D3 easier
Quick React+D3 integration
Scalable dataviz components with full integration
React, D3, and hooks
Detailed walkthrough of a large dataviz dashboard project
Game loop animation
Animating with transitions
Hybrid animation for complex interactions
Enter/update/exit animation
Redux and MobX basics
Rendering to Canvas
Refactoring to React Hooks
All extra projects you can use as a cookbook
Monthly livestream of a real dataviz project
Money-back guarantee
Yours forever
D3 the good parts
How React makes D3 easier
Quick React+D3 integration
Scalable dataviz components with full integration
React, D3, and hooks
Detailed walkthrough of a large dataviz dashboard project
Game loop animation
Animating with transitions
Hybrid animation for complex interactions
Enter/update/exit animation
Redux and MobX basics
Rendering to Canvas
Refactoring to React Hooks
14 extra projects you can use as a cookbook
Monthly livestream of a real dataviz project
Money-back guarantee
Yours forever
FAQ - Frequently asked Questions
React, for dataviz, really? What about Vue? Svelte?
Yes, really. React is a fantastic tool for anything on the web. The ability to get in there and get your hands dirty, treat chunks of HTML as pure data, and have direct control over rendering is unprecedented.
And nothing better's come around since. I've tried Vue, Svelte, (old) Angular, and a bunch of other frameworks. React still sparks the most joy.
Your best bet to build reusable components your whole team can understand.
Can't I just use a library?
Yes! Libraries are fantastic.
I used Victory.js the other day (based on React and D3) and it was lovely. Made a basic chart in 5 minutes. 😍
Then I couldn't figure out how to resize the damn thing so it wouldn't fill the whole screen. An hour I wasted on that. AN HOUR. Never figured it out.
So now I have a chart that fills the whole screen and looks weird on desktop.
That's the problem with libraries. Easy to get started, crazy hard to customize. God help you, if you want to step off the beaten path.
React for Dataviz walks you through the basics of some popular libraries and their tradeoffs, if that fits your needs. Main goal is to teach you how to go custom 🤘
Do I need to be a React expert? JavaScript expert? D3 expert?
React for Dataviz is designed for React beginners. It was originally a head-fake to learn React in a more interesting way :)
You'll need to know JavaScript. RDV doesn't teach you that.
You'll learn everything you need about D3. And we avoid the confusing parts you don't need when you're using React.
What if I hate React or don't use it at work?
No worries. The core ideas in RDV work with any framework. You can use the same approach with Vue, Angular, or Svelte. Only difference is the syntax for rendering.
Like where in React you'd write some JSX, with Vue you'd write template stuff. Where React has hooks, Vue has getters.
Maybe I'll throw in a bonus video or two 🤔
I'm not from USA and your course is expensive as heck. Can I get a discount?
React for Dataviz uses location-based pricing. Adjusted for every country on the BigMac Index based on your IP.
If you don't see a regional discount and think you should, send me an email.
What if I don't care about dataviz?
Well that's a tough one. Do you care about having fun? About doing something creative with React? Want to stretch your mind, see what React can do that you never thought of before?
Try React for Dataviz. I think you'll like it.
I bought some version of React+D3 in the past 5 years. Do I get access automatically?
That depends.
React+D3 went through several major rewrites. When it became a course in late 2018 / early 2019 was the last major change.
The update for 2020 and changing focus to React Hooks is a significant update, but it's not a rewrite. If you accessed your current material through Teachable, you'll get access to the new stuff automatically. I'll be in touch.
You have to purchase again to access the special workshop on Jun 25th ✌️
I can't make it to the workshop on June 25th, should I still purchase ReactForDataviz or can I wait?
The workshop is special. Only for folks who buy now.
You'll get the full recording after. It will not become part of the course itself.
What if I hate your course?
30 day guarantee. Send an email, get a refund.
Refund first, ask questions later. I like to know what bugged you and I don't make your answer a condition for refunding.
Can't I just figure this out myself? Am I too advanced?
You definitely can! I did.
My time tracker says I've spent 834 hours of my life on this material. Writing, researching, some marketing.
How much is 834 hours worth to you? Even if you make just $10/hour like I did at my first web agency coding job, that's still $8,340.
😉