

D3blackbox magic trick – render anything in 30 seconds
Let me show you a magic trick. 30 seconds to take a random D3 piece of code and add it to your React project.
We can try it on the example barchart from before.
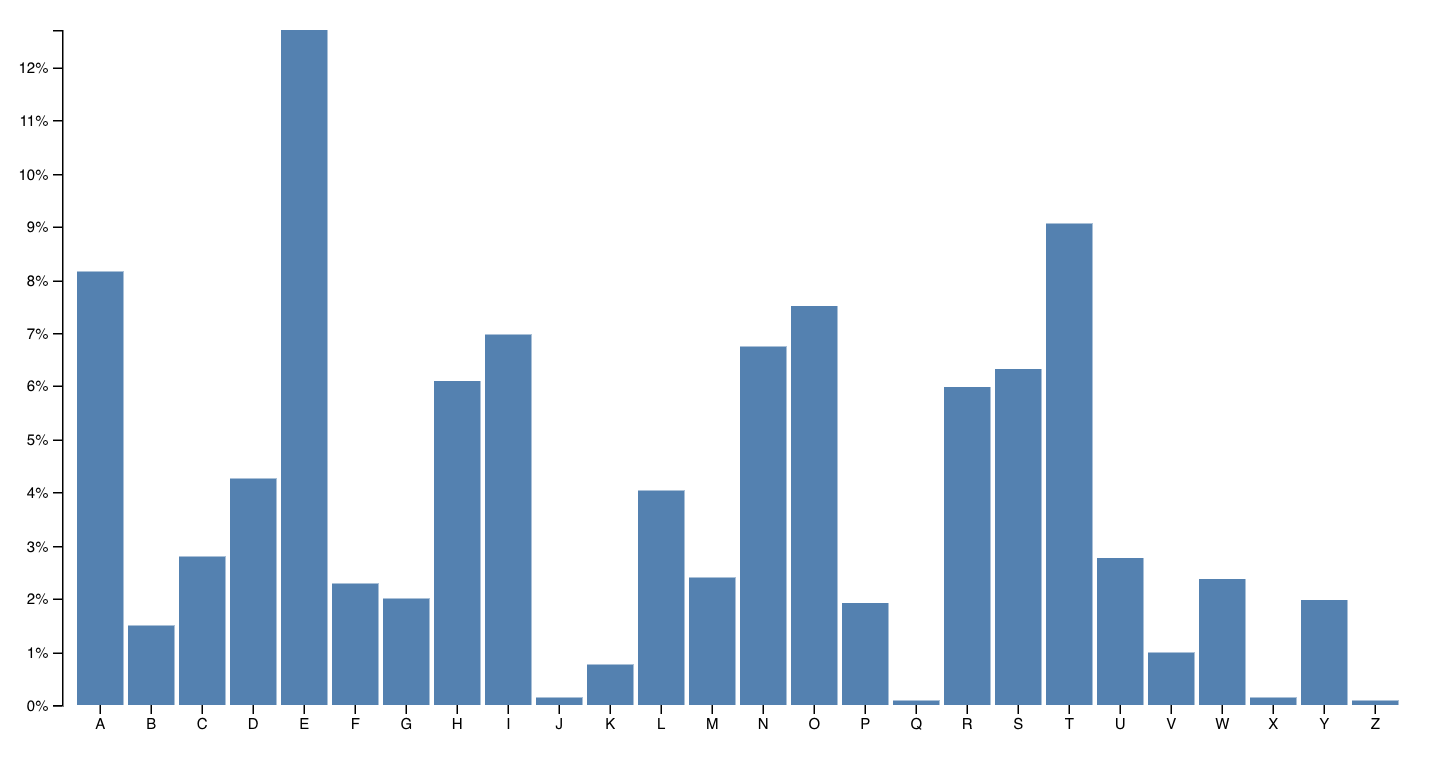
You can try it online. When you hover on a bar, it changes color. Pretty neat.
I recommend you follow along in a CodeSandbox. If you fork the react-d3-axis-hoc CodeSandbox that will be easiest.
You should already have the D3blackbox HOC. If you don't, make a new file and
paste it in.
With your HOC ready, create a new file in CodeSandbox. Call it Barchart.js.
Add your imports:
import React from "react"import D3blackbox from "./D3blackbox"import * as d3 from "d3"
This gives you React, our HOC, and D3.
Now right-click view code on that barchart and copy the code. Wrap it in a
D3blackbox call. Like this:
const Barchart = D3blackbox(function () {var svg = d3.select("svg"),margin = { top: 20, right: 20, bottom: 30, left: 40 },width = +svg.attr("width") - margin.left - margin.right,height = +svg.attr("height") - margin.top - margin.bottomvar x = d3.scaleBand().rangeRound([0, width]).padding(0.1),y = d3.scaleLinear().rangeRound([height, 0])var g = svg.append("g").attr("transform", "translate(" + margin.left + "," + margin.top + ")")d3.tsv("data.tsv",function (d) {d.frequency = +d.frequencyreturn d},function (error, data) {if (error) throw errorx.domain(data.map(function (d) {return d.letter}))y.domain([0,d3.max(data, function (d) {return d.frequency}),])g.append("g").attr("class", "axis axis--x").attr("transform", "translate(0," + height + ")").call(d3.axisBottom(x))g.append("g").attr("class", "axis axis--y").call(d3.axisLeft(y).ticks(10, "%")).append("text").attr("transform", "rotate(-90)").attr("y", 6).attr("dy", "0.71em").attr("text-anchor", "end").text("Frequency")g.selectAll(".bar").data(data).enter().append("rect").attr("class", "bar").attr("x", function (d) {return x(d.letter)}).attr("y", function (d) {return y(d.frequency)}).attr("width", x.bandwidth()).attr("height", function (d) {return height - y(d.frequency)})})})export default Barchart
That should throw some errors. We have to change the d3.select and get
width and height from props.
const Barchart = D3blackbox(function () {// Delete the line(s) between here...var svg = d3.select("svg"),// ...and here.// Insert the line(s) between here...var svg = d3.select(this.anchor.current)// ...and here.margin = {top: 20, right: 20, bottom: 30, left: 40},// Delete the line(s) between here...width = +svg.attr("width") - margin.left - margin.right,height = +svg.attr("height") - margin.top - margin.bottom;// ...and here.// Insert the line(s) between here...width = +this.props.width - margin.left - margin.right,height = +this.props.height - margin.top - margin.bottom;// ...and here.
Most D3 examples use a global svg variable to refer to their drawing area
– the SVG. Change that to the element you want, your anchor, and the whole
visualization should render in there.
We also replaced reading width and height from the SVG element to getting them from props. This makes our component more reusable and better follows best practices.
Next step is to change where our barchart gets its data. Gotta use the public URL.
//Delete the line(s) between here...d3.tsv("data.tsv", function(d) {// ...and here.// Insert the line(s) between here...d3.tsv("https://swizec.github.io/dl/barchart.tsv", function(d) {// ...and here.d.frequency = +d.frequency;return d;// Delete the line(s) between here...}, function(error, data) {if (error) throw error;// ...and here.// Insert the line(s) between here...}).then(function(data) {// ...and here.
Same link, absolute version. And we updated the callback-based code to use the D3v5 promises version. That's the most disruptive change going from v4 to v5 I believe.
That's it. You now have a Barchart component that renders the example barchart from D3's docs.
You can use it like this 👇 I recommend adding this code to the main App component that CodeSandbox creates for you.
import Barchart from "./Barchart"// ...return (<svg width="800" height="600"><Barchart x={10} y={10} width={400} height={300} /></svg>)
But like I said, don't use this in production. It's great for quick prototypes, trying stuff out, or seeing how an existing visualization might fit your app.
A note about D3blackbox
To make your life easier, I have open sourced my version of the D3blackbox HOC. You can read more about it at d3blackbox.com
Works the same as the HOC we just built together, adds the anchor ref, props,
and state to function arguments so it's easier to use. No need to mess with
this if you don't want to :)
Install it from npm:
$ npm install d3blackbox
Then use it as you would your own HOC:
import React from "react"import D3blackbox from "d3blackbox"import * as d3 from "d3"const Barchart = D3blackbox(function (anchor, props, state) {const svg = d3.select(anchor.current)// the rest of your D3 code})export default Barchart
The function you pass into D3blackbox is still your full D3 render. Except
now you can access important values directly without using this.
You can use my D3blackbox or build your own. What's important is that you now understand how higher order components work.