Build scalable dataviz components with full integration
This section builds up your mental models for dataviz components through the class-based approach. If you don't care about those details, you can jump ahead to React Hooks.
As useful as blackbox components are, we need something better if we want to leverage React's rendering engine. The blackbox approach in particular struggles with scale. The more charts and graphs and visualizations on your screen, the slower it gets.
Someone once came to my workshop and said "We used the blackbox approach and it takes several seconds to re-render our dashboard on any change. I'm here to learn how to do it better."
In our full-feature integration, React does the rendering and D3 calculates the props.
Our goal is to build controlled components that listen to their props and reconcile that with D3's desire to use a lot of internal state.
There are two situations we can find ourselves in:
- We know for a fact our component's props never change
- We think props could change
It's easiest to show you with an example.
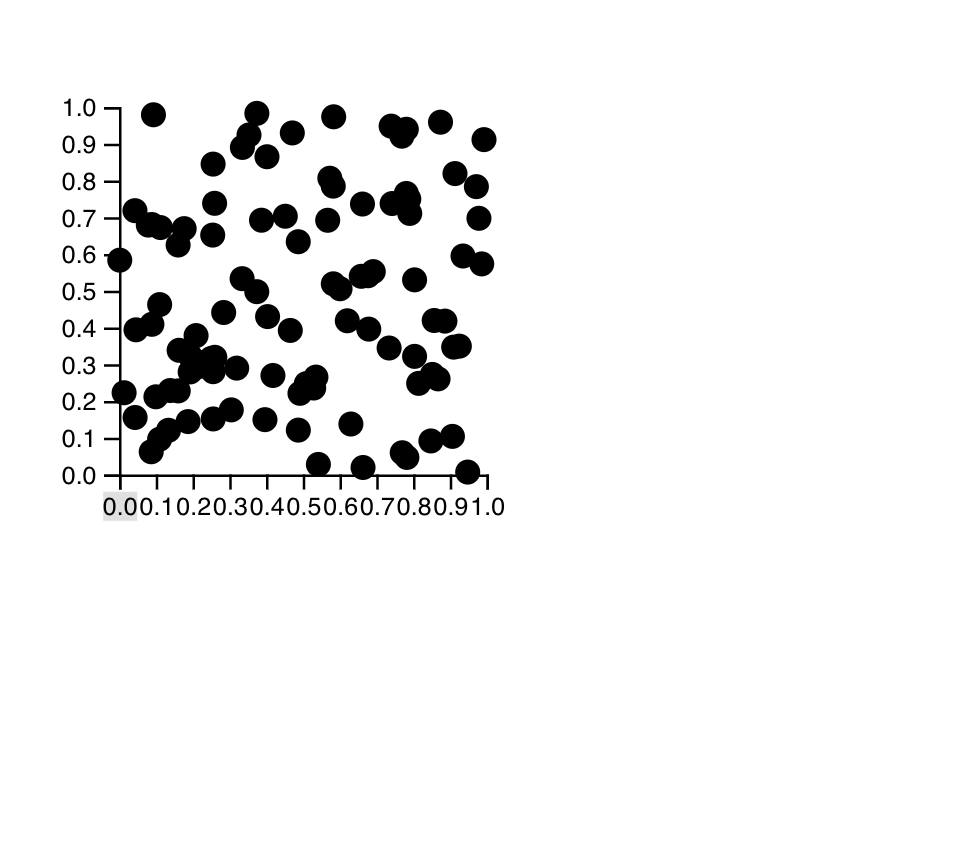
Let's build a scatterplot step by step. Take a random array of two-dimensional data, render in a loop. Make magic.
Something like this 👇
You've already built the axes! Copy pasta time.
Props don't change
Ignoring props changes makes our life easier, but the component less flexible and reusable. Great when you know in advance that there are features you don't ned to support.
Like, no filtering your data or changing component size 👉 means your D3 scales don't have to change.
When our props don't change, we follow a 2-step integration process:
- set up D3 objects as class properties
- output SVG in
render()
We don't have to worry about updating D3 objects on prop changes. Work done 👌
An unchanging scatterplot
We're building a scatterplot of random data. You can see the final solution on CodeSandbox
Here's the approach 👇
- stub out the basic setup
- generate random data
- stub out Scatterplot
- set up D3 scales
- render circles for each entry
- add axes
I recommend creating a new CodeSandbox, or starting a new app with create-react-app. They should work the same.
Basic setup
Make sure you have d3 added as a dependency. Then add imports in your
App.js file.
// ./App.jsimport * as d3 from "d3"import Scatterplot from "./Scatterplot"
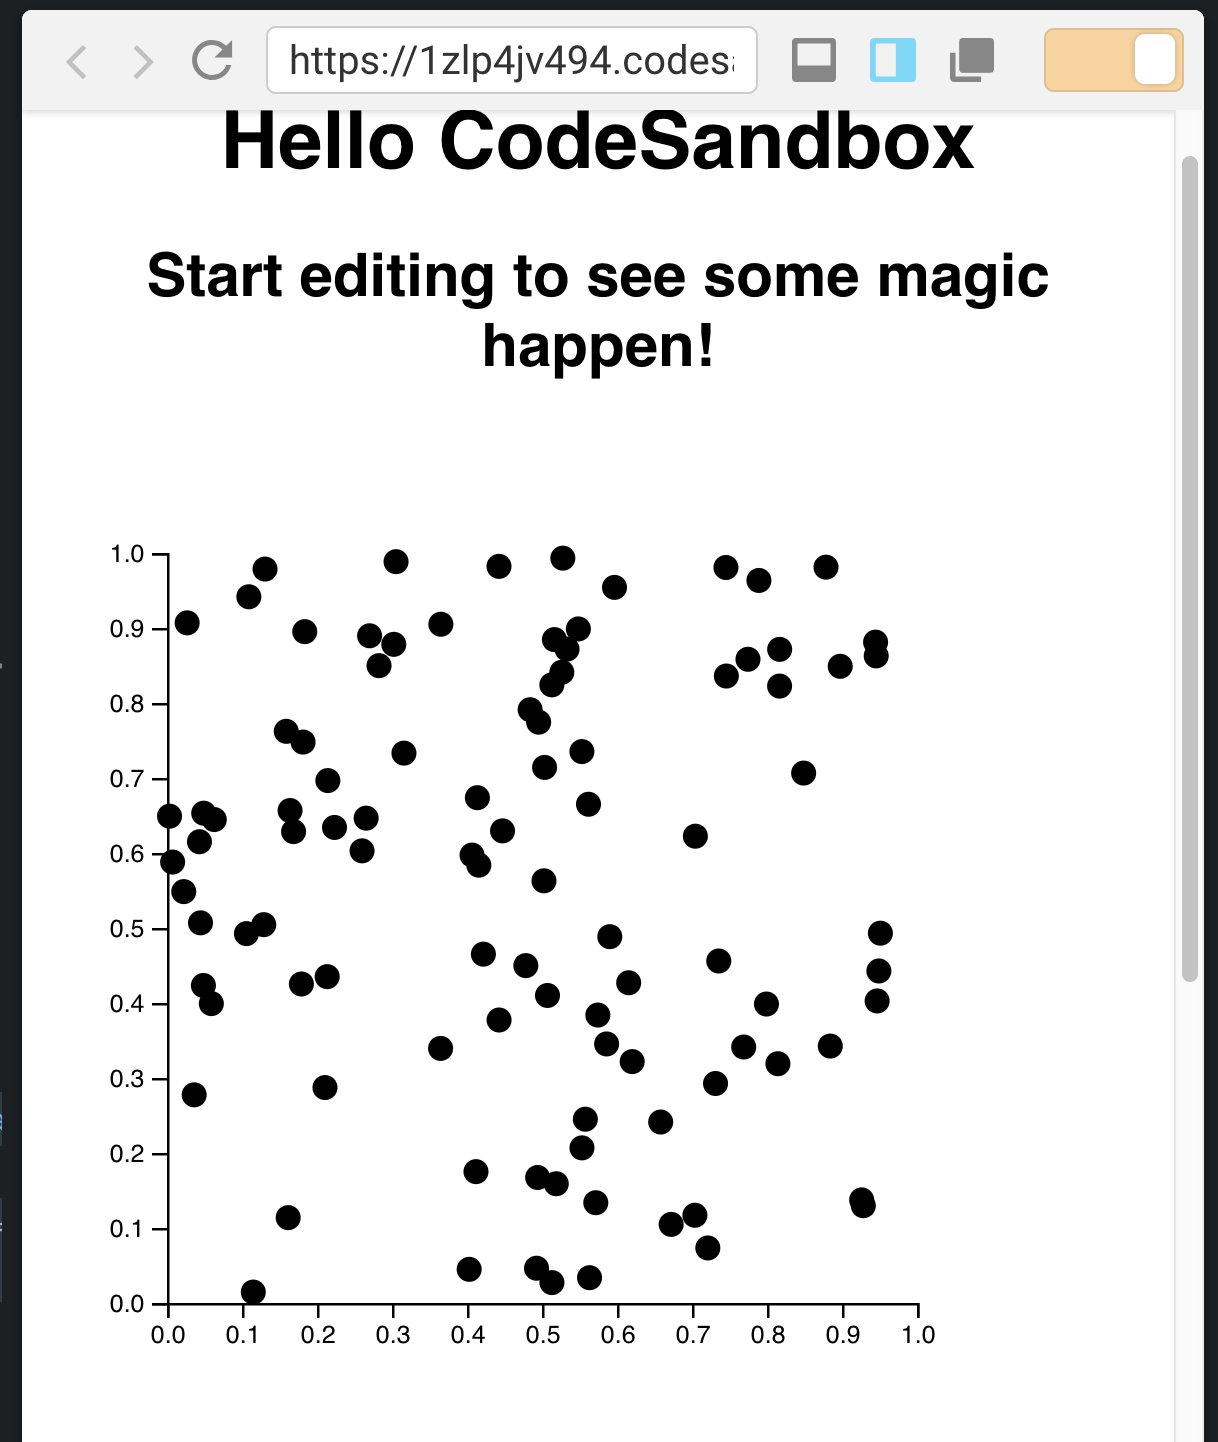
Add an <svg> and render a Scatterplot in the render method. This will throw
an error because we haven't defined the Scatterplot yet and that's okay.
// ./App.jsfunction App() {return (<div className="App"><h1>Hello CodeSandbox</h1><h2>Start editing to see some magic happen!</h2><svg width="800" height="800"><Scatterplot x={50} y={50} width={300} height={300} data={data} /></svg></div>)}
CodeSandbox adds most of that code by default. If you're using create-react-app, your App component has different markup. That's okay too.
We added this part:
<svg width="800" height="800"><Scatterplot x={50} y={50} width={300} height={300} data={data} /></svg>
An <svg> drawing area with a width and a height. Inside, a <Scatterplot
that's positioned at (50, 50) and is 300px tall and wide. We'll have to
listen to those props when building the Scatterplot.
It also accepts data.
Random data
We're using a line of code to generate data for our scatterplot. Put it in App.js. Either globally or within the App function. Doesn't matter because this is an example.
const data = d3.range(100).map((_) => [Math.random(), Math.random()])
d3.range returns a counting array from 0 to 100. Think [1,2,3,4 ...].
We iterate over this array and return a pair of random numbers for each entry. These will be our X and Y coordinates.
Scatterplot
Our scatterplot goes in a new Scatterplot.js file. Starts with imports and an
empty React component.
// ./Scatterplot.jsimport React from "react"import * as d3 from "d3"class Scatterplot extends React.Component {render() {const { x, y, data, height } = this.propsreturn <g transform={`translate(${x}, ${y})`}></g>}}export default Scatterplot
Import dependencies, create a Scatterplot component, render a grouping
element moved to the correct x and y position. Nothing too strange yet.
D3 scales
Now we define D3 scales as component properties. We're using the class field syntax that's common in React projects.
Technically a Babel plugin, but comes by default with CodeSandbox React projects and create-react-app setup. As far as I can tell, it's a common way to write React components.
// ./Scatterplot.jsclass Scatterplot extends React.Component {xScale = d3.scaleLinear().domain([0, 1]).range([0, this.props.width]);yScale = d3.scaleLinear().domain([0, 1]).range([this.props.height, 0]);
We're defining this.xScale and this.yScale as linear scales. Their domains
go from 0 to 1 because that's what Math.random returns and their ranges
describe the size of our scatterplot component.
Idea being that these two scales will help us take those tiny variations in datapoint coordinates and explode them up to the full size of our scatterplot. Without this, they'd overlap and we wouldn't see anything.
Circles for each entry
Rendering our data points is a matter of looping over the data and rendering a
<circle> for each entry. Using our scales to define positioning.
// ./Scatterplot.jsreturn (<g transform={`translate(${x}, ${y})`}>{data.map(([x, y]) => (<circle cx={this.xScale(:satisfied:} cy={this.yScale(y)} r="5" />))}</g>);
In the return statement of our render render method, we add a data.map
with an iterator method. This method takes our datapoint, uses array
destructuring to get x and y coordinates, then uses our scales to define
cx and cy attributes on a <circle> element.
Add axes
You can reuse axes from our earlier exercise. Or copy mine from the CodeSandbox
Mine take a scale and orientation as props, which makes them more flexible. Means we can use the same component for both the vertical and horizontal axis on our Scatterplot.
Put the axis code in Axis.js, then augment the Scatterplot like this
👇
import Axis from "./Axis";// ...return (<g transform={`translate(${x}, ${y})`}>{data.map(([x, y]) => (<circle cx={this.xScale(:satisfied:} cy={this.yScale(y)} r="5" />))}<Axis x={0} y={0} scale={this.yScale} type="Left" /><Axis x={0} y={height} scale={this.xScale} type="Bottom" /></g>);
Vertical axis takes the vertical this.yScale scale, orients to the Left and
we position it top left. The horizontal axis takes the horizontal this.xScale
scale, orients to the Bottom, and we render it bottom left.
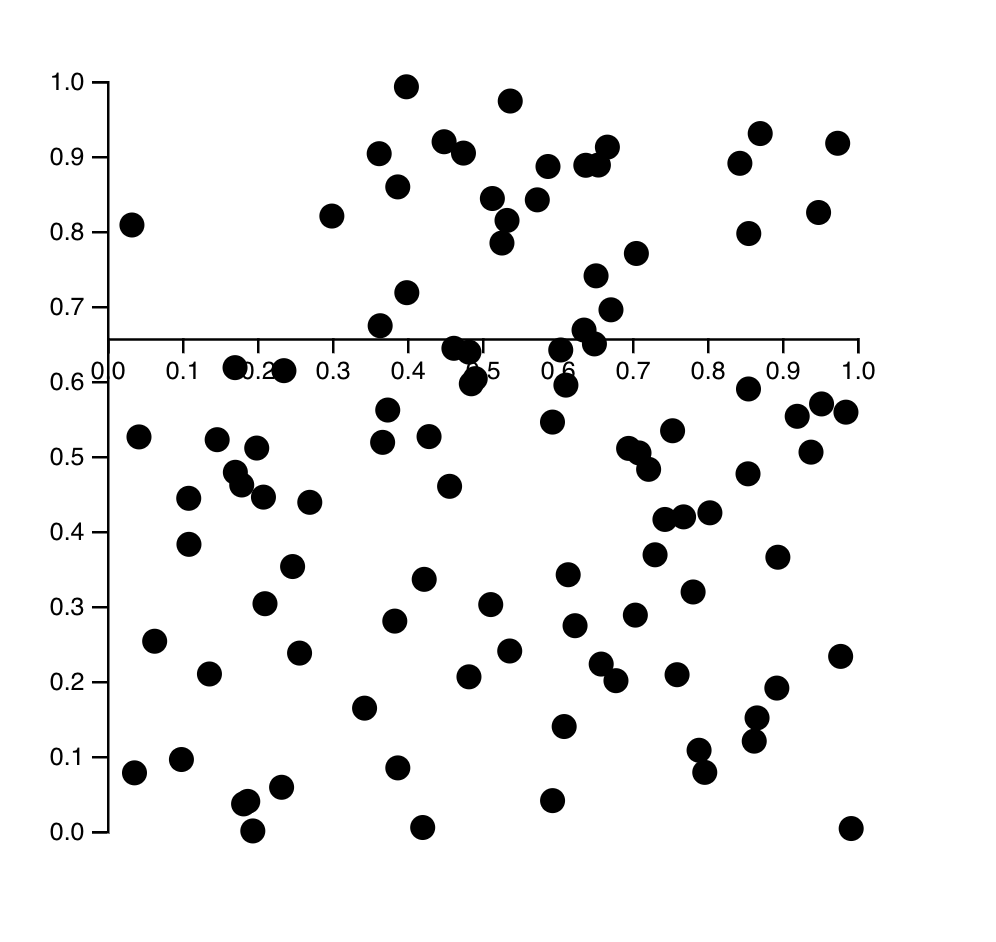
Your Scatterplot should now look like this
Props might update
The story is a little different when our props might update. Since we're using D3 objects to calculate SVG properties, we have to make sure those objects are updated before we render.
No problem in React 15: Update in componentWillUpdate. But since React 16.3
we've been told never to use that again. Causes problems for modern async
rendering.
The official recommended solution is that anything that used to go in
componentWillUpdate, can go in componentDidUpdate. But not so fast!
Updating D3 objects in componentDidUpdate would mean our visualization always
renders one update behind. Stale renders! 😱
The new getDerivedStateFromProps to the rescue. Our integration follows a
3-step pattern:
- set up D3 objects in component state
- update D3 objects in
getDerivedStateFromProps - output SVG in
render()
getDerivedStateFromProps is officially discouraged, and yet the best tool we
have to make sure D3 state is updated before we render.
Because React calls getDerivedStateFromProps on every component render, not
just when our props actually change, you should avoid recalculating complex
things too often. Use memoization helpers, check for changes before updating,
stuff like that.
An updateable scatterplot
Let's update our scatterplot so it can deal with resizing and updating data.
3 steps 👇
- add an interaction that resizes the scatterplot
- move scales to state
- update scales in
getDerivedStateFromProps
You can see my final solution on CodeSandbox. I recommend you follow along updating your existing code.
Resize scatterplot on click
To test our scatterplot's adaptability, we have to add an interaction: Resize the scatterplot on click.
That change happens in App.js. Click on the <svg>, reduce width and height
by 30%.
Move sizing into App state and add an onClick handler.
// App.jsclass App extends React.Component {state = {width: 300,height: 300};onClick = () => {const { width, height } = this.state;this.setState({width: width * 0.7,height: height * 0.7});};render() {const { width, height } = this.state;
We changed our App component from a function to a class, added state with
default width and height, and an onClick method that reduces size by 30%.
The render method reads width and height from state.
Now gotta change rendering to listen to these values and fire the onClick
handler.
// App.js<svg width="800" height="800" onClick={this.onClick}><Scatterplot x={50} y={50} width={width} height={height} data={data} /></svg>
Similar rendering as before. We have an <svg> that contains a
<Scatterplot>. The svg fires this.onClick on click events and the
scatterplot uses our width and height values for its props.
If you try this code now, you should see a funny effect where axes move, but the scatterplot doesn't resize.
Peculiar isn't it? Try to guess why.
Move scales to state
The horizontal axis moves because it's render at height vertical coordinate.
Datapoints don't move because the scales that position them are calculated once
– on component mount.
First step to keeping scales up to date is to move them from component values into state.
// Scatterplot.jsclass Scatterplot extends React.Component {state = {xScale: d3.scaleLinear().domain([0, 1]).range([0, this.props.width]),yScale: d3.scaleLinear().domain([0, 1]).range([this.props.height, 0])};
Same scale definition code we had before. Linear scales, domain from 0 to 1,
using props for ranges. But now they're wrapped in a state = {} object and
it's xScale: d3 ... instead of xScale = d3 ....
Our render function should use these as well. Small change:
// Scatterplot.jsrender() {const { x, y, data, height } = this.props,{ yScale, xScale } = this.state;return (<g transform={`translate(${x}, ${y})`}>{data.map(([x, y]) => <circle cx={xScale(:satisfied:} cy={yScale(y)} r="5" />)}
We use destructuring to take our scales from state, then use them when mapping over our data.
Clicking on the SVG produces the same result as before, but we're almost there. Just one more step.
Update scales in getDerivedStateFromProps
Last step is to update our scales' ranges in getDerivedStateFromProps. This
method runs every time React touches our component for any reason.
// Scatterplot.jsclass Scatterplot extends React.PureComponent {// ..static getDerivedStateFromProps(props, state) {const { yScale, xScale } = state;yScale.range([props.height, 0]);xScale.range([0, props.width]);return {...state,yScale,xScale};}
Take scales from state, update ranges with new values, return new state. Nice and easy.
Notice that getDerivedStateFromProps is a static method shared by all
instances of our Scatterplot component. You have no reference to a this and
have to calculate new state purely from the props and state passed into
your method.
It's a lot like a Redux reducer, if that helps you think about it. If you don't know what Redux reducers are, don't worry. Just remember to return a new version of component state.
Your Scatterplot should now update its size on every click.