

Making your components more flexible with render props
Render props are a great technique for making your components more flexible. React Hooks make them less critical but still a very useful technique.
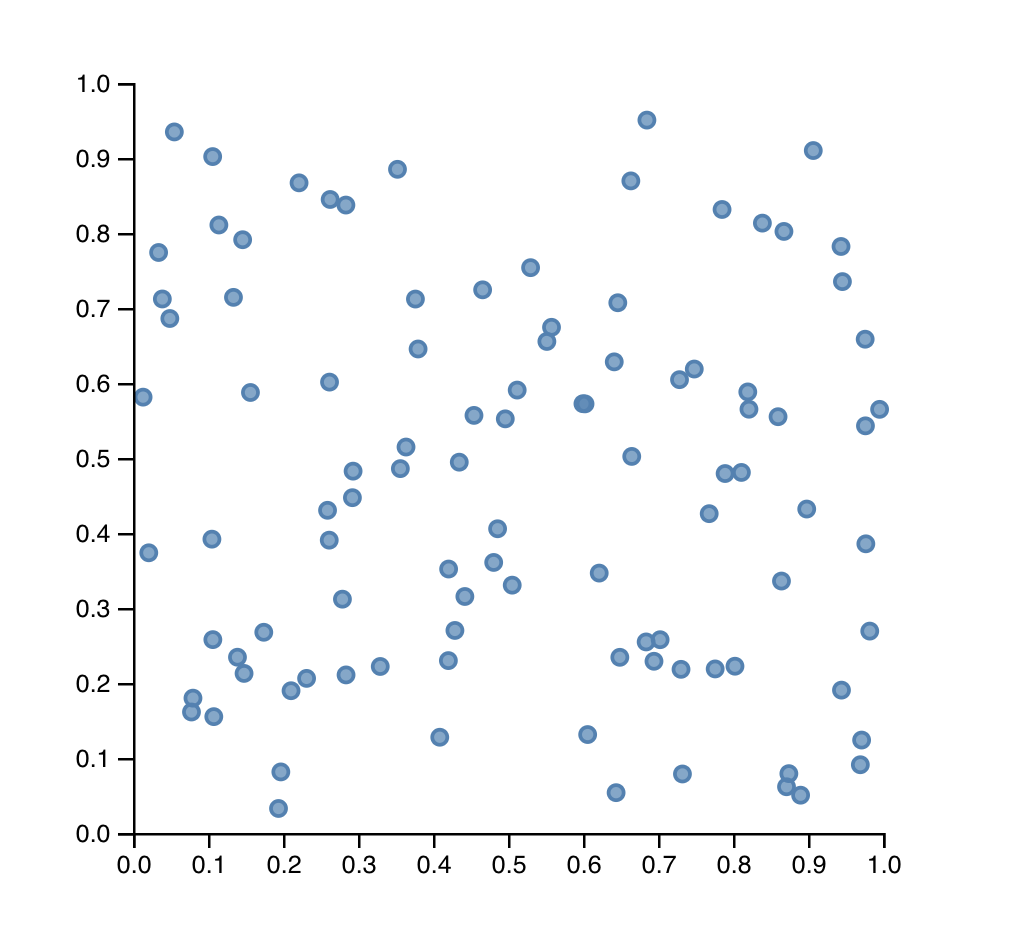
Our scatterplot doesn't look quite as nice as the earlier screenshot. Regular SVG circles with no styling just can't match up.
What if we wanted to render beautiful circles? Or stars? Or maybe something else entirely?
We can use render props to give users of our scatterplot component the power to define how they want datapoints to render. 😱
Think of it as a sort of inversion of control. Another common buzzword are "slots", or renderless components. The idea is that one of our props accepts a React component.
We then use that prop to render our datapoints.
It looks a little like this 👇
<Scatterplotx={10} y={10}data={data}datapoint={(props) => <Datapoint {...props} />}>
What's more, we can add interactions and other useful stuff to our
<Datapoint> and <Scatterplot> doesn't have to know anything about it. All
the scatterplot cares about is rendering two axes and a bunch of datapoints.
Let's use the render prop approach to make our scatterplot more reusable.
Steps 👇
- pass in a render prop
- use it to render datapoints
- make datapoint component look nice
You can see my solution on CodeSandbox. I recommend you follow along with your existing code.
Pass in a render prop
React components are Just JavaScript. Either a JSX function call or a function that returns some JSX.
That means we can pass them into components via props. Let's do that in App.js
// App.jsimport Datapoint from "./Datapoint"//..;<svg width="800" height="800" onClick={this.onClick}><Scatterplotx={50}y={50}width={width}height={height}data={data}datapoint={({ x, y }) => <Datapoint x={x} y={y} />}/></svg>
For extra flexibility and readability we're wrapping our <Datapoint>
component in another function that accepts x and y coordinates. This is a
common pattern you'll see with render props 👉 it gives you the
ability to pass in props from both the rendering component and the component
that's setting the render prop.
Say we wanted Datapoint to know something about our App and our Scatterplot.
The scatterplot calls this function with coordinates. We pass those into
<Datapoint>. And because the method is defined inside App, we could pass-in
anything that's defined in the App. Like perhaps data.
Your code will start throwing an error now. Datapoint isn't defined. Don't worry, it's coming soon.
Use render prop to render datapoints
To use our new datapoint render prop, we have to change how we render the
scatterplot. Instead of returning a <circle> for each iteration of the
dataset, we're calling a function passed in from props.
// Scatterplot.jsrender() {const { x, y, data, height, datapoint } = this.props,{ yScale, xScale } = this.state;return (<g transform={`translate(${x}, ${y})`}>{data.map(([x, y]) => datapoint({x: xScale(:satisfied:,y: yScale(y)}))}
We take the datapoint function from props and call it in data.map making
sure to pass in x and y as an object. Calling functions with objects like
this is a common JavaScript pattern to fake named arguments.
Make datapoint component look nice
We've got all the rendering, now all we need is the <Datapoint component
itself. That goes in a new Datapoint.js file.
import React from "react"import styled from "styled-components"const Circle = styled.circle`fill: steelblue;fill-opacity: 0.7;stroke: steelblue;stroke-width: 1.5px;`class Datapoint extends React.Component {render() {const { x, y } = this.propsreturn <Circle cx={x} cy={y} r={3} />}}export default Datapoint
I'm using styled-components to define the CSS for my Datapoint. You can use whatever you prefer. I like styled components because they're a good balance between CSS-in-JS and normal CSS syntax.
The component itself renders a styled circle using props for positioning and a radius of 3 pixels.
For an extra challenge, try rendering circle radius from state and changing datapoint size on mouse over. Make the scatterplot interactive.