

What about existing libraries?
The quickest way to achieve the benefits of integrating React with D3 is to use a library. A collection of components with pre-built charting visualizations. Plug it into your app, move on with life.
Great option for basic charts. I recommend it dearly to anyone who comes to me and asks about building stuff. Try a library first. If it fits your needs, perfect! You just saved yourselves plenty of time.
Where libraries become a problem is when you want to move beyond the library author's idea of How Things Are Done. Custom features, visualizations that aren't just charts, disabling this or that default behavior ... it gets messy.
That's why I rarely use libraries myself. Often find it quicker to build something specific from scratch than figuring out how to hold a generalized API just right.
But they're a great first step. Here's a few of the most popular React & D3 libraries 👇
List borrowed from a wonderful Smashing Magazine article, because it's a good list.
Victory.js
React.js components for modular charting and data visualization
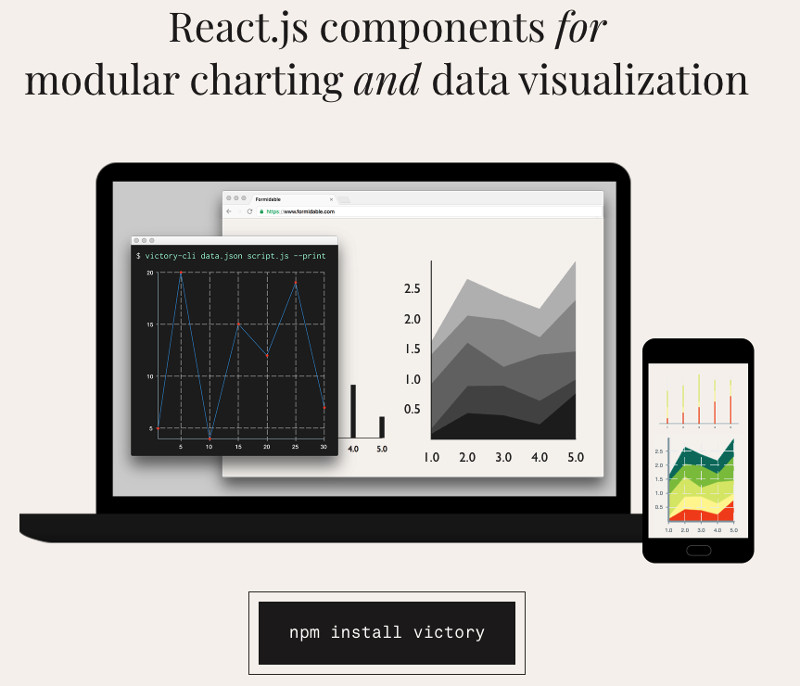
Victory offers low level components for basic charting and reimplements a lot of D3's API. Great when you need to create basic charts without a lot of customization. Supports React Native.
Here's what it takes to implement a Barchart using Victory.js. You can try it on CodeSandbox
const data = [{ quarter: 1, earnings: 13000 },{ quarter: 2, earnings: 16500 },{ quarter: 3, earnings: 14250 },{ quarter: 4, earnings: 19000 },]const App = () => (<div style={styles}><h1>Victory basic demo</h1><VictoryChart domainPadding={20}><VictoryBar data={data} x="quarter" y="earnings" /></VictoryChart></div>)
Create some fake data, render a <VictoryChart> rendering area, add a
<VictoryBar> component, give it data and axis keys. Quick and easy.
My favorite feature of Victory is that components use fake random data until you pass your own. Means you always know what to expect.
Recharts
A composable charting library built on React components
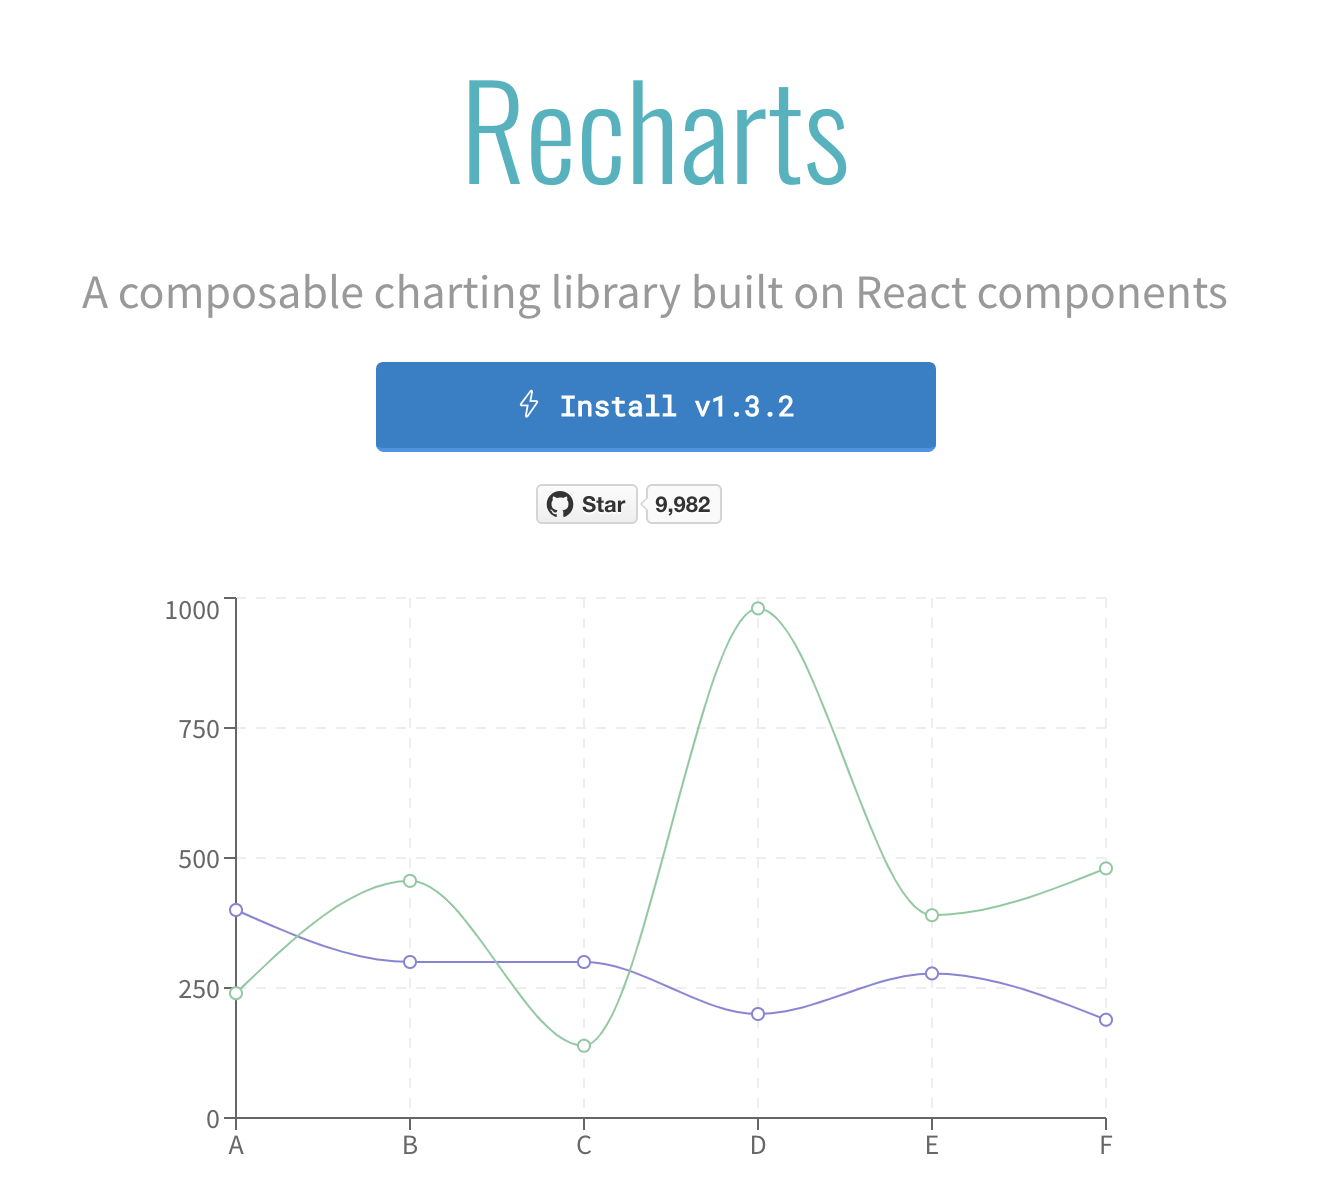
Recharts is like a more colorful Victory. A pile of charting components, some customization, loves animating everything by default.
Here's what it takes to implement a Barchart using Recharts. You can try it on CodeSandbox
const data = [{ quarter: 1, earnings: 13000 },{ quarter: 2, earnings: 16500 },{ quarter: 3, earnings: 14250 },{ quarter: 4, earnings: 19000 },]const App = () => (<div style={styles}><h1>Recharts basic demo</h1><BarChart width={500} height={300} data={data}><XAxis dataKey="quarter" /><YAxis dataKey="earnings" /><Bar dataKey="earnings" /></BarChart></div>)
More involved than Victory, but same principle. Fake some data, render a
drawing area this time with <BarChart> and feed it some data. Inside the
<BarChart> render two axes, and a <Bar> for each entry.
Recharts hits a great balance of flexibility and ease ... unless you don't like animation by default. Then you're in trouble.
PS: Recharts v2 is currently in beta. The API of how it works might soon change
Nivo
nivo provides a rich set of dataviz components, built on top of the awesome d3 and Reactjs libraries.
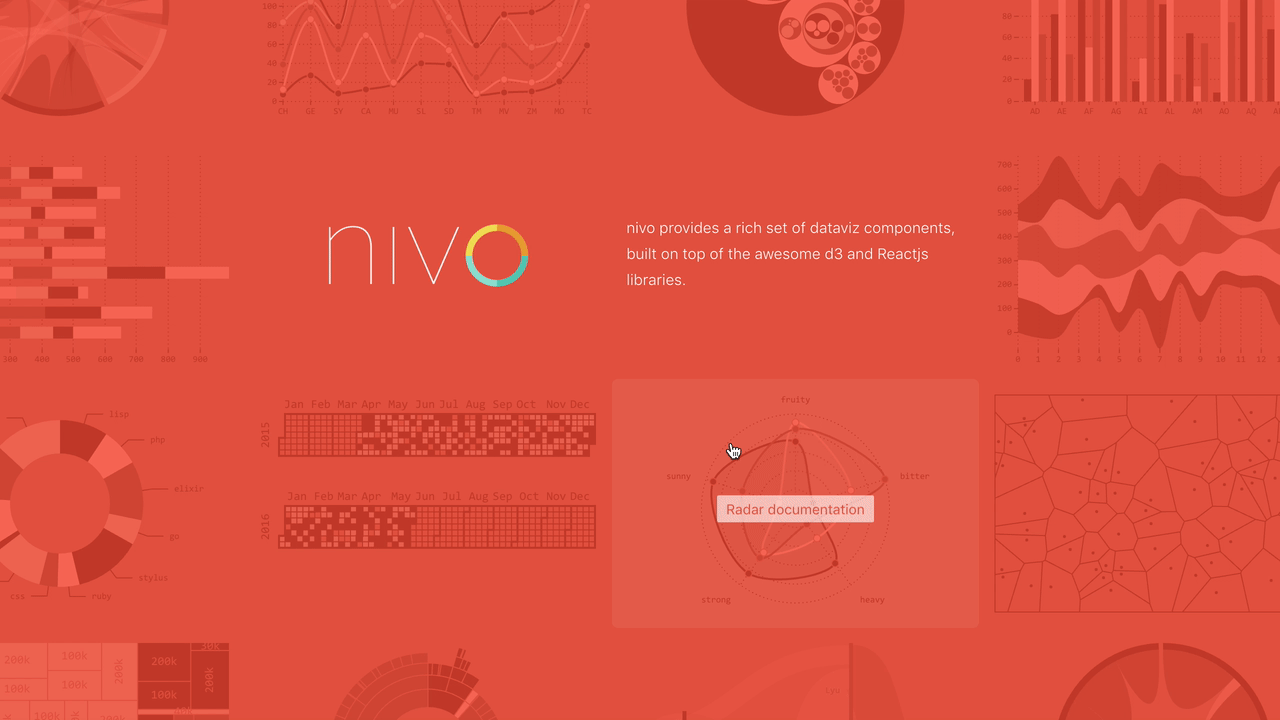
Nivo is another attempt to give you a set of basic charting components. Comes with great interactive documentation, support for Canvas and API rendering. Plenty of basic customization.
Here's what it takes to implement a Barchart using Nivo. You can try it on CodeSandbox
const data = [{ quarter: 1, earnings: 13000 },{ quarter: 2, earnings: 16500 },{ quarter: 3, earnings: 14250 },{ quarter: 4, earnings: 19000 },]const App = () => (<div style={styles}><h1>Nivo basic demo</h1><div style={{ height: "400px" }}><ResponsiveBar data={data} keys={["earnings"]} indexBy="quarter" /></div></div>)
Least amount of effort! You render a <ResponsiveBar> component, give it data
and some params, and Nivo handles the rest.
Wonderful! But means you have to learn a whole new language of configs and props that might make your hair stand on end. The documentation is great and shows how everything works, but I found it difficult to know which prop combinations are valid.
VX
vx is collection of reusable low-level visualization components. vx combines the power of d3 to generate your visualization with the benefits of react for updating the DOM.

VX is the closest to the approaches you're learning in this book. React for rendering, D3 for calculations. When you build a set of custom components for your organization, a flavor of VX is what you often come up with.
That's why I recommend teams use VX when they need to get started quickly.
Here's what it takes to implement a Barchart using Nivo. You can try it on CodeSandbox
const data = [{ quarter: 1, earnings: 13000 },{ quarter: 2, earnings: 16500 },{ quarter: 3, earnings: 14250 },{ quarter: 4, earnings: 19000 }];const App = ({ width = 400, height = 400 }) => {const xMax = width;const yMax = height - 120;const x = d => d.quarter;const y = d => d.earnings;// scalesconst xScale = scaleBand({rangeRound: [0, xMax],domain: data.map(:satisfied:,padding: 0.4});const yScale = scaleLinear({rangeRound: [yMax, 0],domain: [0, max(data, y)]});return (<div style={styles}><h1>VX basic demo</h1><svg width={width} height={height}>{data.map((d, i) => {const barHeight = yMax - yScale(y(d));return (<Barwidth={xScale.bandwidth()}height={barHeight}x={xScale(x(d))}y={yMax - barHeight}data={{ x: x(d), y: y(d) }}/>);})}</svg></div>);};
Move involved than previous examples, but means you have more control and fight the library less often. VX does the tedious stuff for you, so you can focus on the stuff that matters.
This code creates value accessor methods, D3 scales, then iterates over an
array of data and renders a <Bar> for each. The bar gets a bunch of props.