

"lol you can become a famous artist by just painting colorful squares"
Yeah turns out generative art is really hard. And Mondrian did it manually.

Piet Mondrian was a Dutch painter famous for his style of grids with basic squares and black lines. So famous in fact, Google finds him as "squares art guy".
The signature style grew out of his earlier cubist works seeking a universal beauty understood by a all humans.
I believe it is possible that, through horizontal and vertical lines constructed with awareness, but not with calculation, led by high intuition, and brought to harmony and rhythm, these basic forms of beauty, supplemented if necessary by other direct lines or curves, can become a work of art, as strong as it is true.

So I figured what better way to experiment with D3 treemaps than to pay an homage to this great artist.
You can watch the full live stream here:
GitHub link here 👉 Swizec/mondrian-generator
And try it out in your browser
It's not as good as Mondrian originals, but we learned a lot 👩🎨
You can read this article online at reactfordataviz.com/articles/mondrian-art-generator/
What is a treemap anyway?
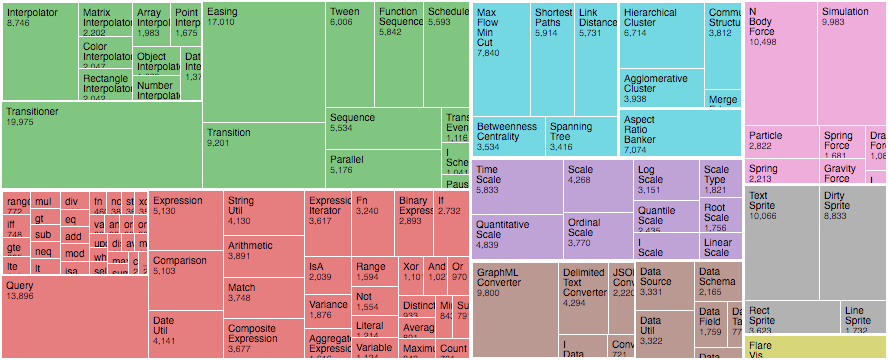
Introduced by Ben Shneiderman in 1991, a treemap recursively subdivides area into rectangles according to each node’s associated value.
In other words, a treemap takes a rectangle and packs it with smaller rectangles based on a tiling algorithm. Each rectangle's area is proportional to the value it represents.
Treemaps are most often used for presenting budgets and other relative sizes. Like in this interactive example of a government budget from 2016.

You can see at a glance most of the money goes to social security, then health care, which is split between medicaid, children's health, etc.
Treemaps are great for recursive data like that.
Using a D3 treemap to generate art with React
We wanted to play with treemaps per a reader's request, but couldn't find an interesting dataset to visualize. Generating data was the solution. Parametrizing it with sliders, pure icing on the cake.
Also I was curious how close we can get :)
3 pieces have to work together to produce an interactive piece of art:
- A recursive rendering component
- A function that generates treemappable data
- Sliders that control inputs to the function
A recursive rendering component
Treemaps are recursive square subdivisions. They come with a bunch of tiling algorithms, the most visually stunning of which is the squarified treemaps algorithm described in 2000 by Dutch researchers.
What is it with Dutch people and neat squares 🤔
While beautiful, the squarified treemaps algorithm did not look like a Mondrian.

Subtle difference, I know, but squarified treemaps are based on the
golden ratio and Piet Mondrian's
art does not look like that. We used the d3.treemapBinary algorithm instead.
It aims to create a balanced binary tree.
main <Mondrian> component
// src/Mondrian.jsconst Mondrian = ({ x, y, width, height, data }) => {const treemap = d3.treemap().size([width, height]).padding(5).tile(d3.treemapBinary);const root = treemap(hierarchy(data).sum(d => d.value).sort((a, b) => 0.5 - Math.random()));return (<g transform={`translate(${x}, ${y})`}><MondrianRectangle node={root} /></g>);};
The <Mondrian> component takes some props and instantiates a new treemap
generator. We could've wrapped this in a useMemo call for better performance,
but it seemed fast enough.
We set the treemap's size() from width and height props, a guessed
padding() of 5 pixels, and a tiling algorithm.
This creates a treemap() generator – a method that takes data and returns
that same data transformed with values used for rendering.
The generator takes a d3-hierarchy, which
is a particular data format shared by all hierarchical rendering generators in
the D3 suite. Rather than build it ourselves, we feed our source data into the
hierarchy() method. That cleans it up for us ✌️
We need the sum() method to tell the hierarchy how to sum up the values of
our squares, and we use random sorting because that produced nicer results.
a <MondrianRectangle> component for each square
We render each level of the resulting treemap with a <MondrianRectangle>
component.
// src/Mondrian.jsconst MondrianRectangle = ({ node }) => {const { x0, y0, x1, y1, children } = node,width = x1 - x0,height = y1 - y0;return (<><rectx={x0}y={y0}width={width}height={height}style={fill: node.data.color,stroke: "black",strokeWidth: 5}onClick={() => alert(`This node is ${node.data.color}`)}/>{children &&children.map((node, i) => <MondrianRectangle node={node} key={i} />)}</>);};
Each rectangle gets a node prop with a bunch of useful properties.
x0, y0defines the top left cornerx1, y1is the bottom right cornerchildrenare the child nodes from our hierarchy
We render an SVG <rect> component as the square representing this node. Its
children we render by looping through the children array and recursively
rendering a <MondrianRectangle> component for each.
The onClick is there just to show how you might make these interactive :)
You can use this same principle to render any data with a treemap.
A Mondrian data generator method
We moved the generative art piece into a custom useMondrianGenerator hook.
Keeps our code cleaner 😌
// src/App.jslet mondrian = useMondrianGenerator({redRatio,yellowRatio,blueRatio,blackRatio,subdivisions,maxDepth,});
The method takes a bunch of arguments that act as weights on randomly generated parameters. Ideally we'd create a stable method that always produces the same result for the same inputs, but that proved difficult.
As mentioned earlier, generative art is hard so this method is gnarly. 😇
Weighed random color generator
We start with a weighed random generator.
// src/useMondrianGenerator.js// Create weighted probability distribution to pick a random color for a squareconst createColor = ({ redRatio, blueRatio, yellowRatio, blackRatio }) => {const probabilitySpace = [...new Array(redRatio * 10).fill('red'),...new Array(blueRatio * 10).fill('blue'),...new Array(yellowRatio * 10).fill('yellow'),...new Array(blackRatio * 10).fill('black'),...new Array(redRatio * 10 + blueRatio * 10 + yellowRatio * 10 + blackRatio * 10).fill('#fffaf1'),];return d3.shuffle(probabilitySpace)[0];};
createColor picks a color to use for each square. It takes desired ratios of
different colors and uses a trick I discovered in college. There are probably
better ways to create a [weighed random method, but this works well and is
something I can understand.
You create an array with the amount of values proportional to the probabilities
you want. If you want red to be twice as likely as blue, you'd use an array
like [red, red, blue].
Pick a random element from that array and you get values based on probabilities.
The result is a createColor method that returns colors in the correct ratio
without knowing context of what's already been picked and what hasn't. ✌️
generating mondrians
The useMondrianGenerator hook itself is pretty long. I'll explain in code
comments so it's easier to follow along :)
// src/useMondrianGenerator.js// Takes inputs and spits out mondriansfunction useMondrianGenerator({redRatio,yellowRatio,blueRatio,blackRatio,subdivisions,maxDepth,}) {// useMemo helps us avoid recalculating this all the time// saves computing resources and makes the art look more stablelet mondrian = useMemo(() => {// calculation is wrapped in a method so we can use recursion// each level gets the current "value" that is evenly split amongst children// we use depth to decide when to stopconst generateMondrian = ({ value, depth = 0 }) => {// each level gets a random number of children based on the subdivisions argumentconst N = Math.round(1 + Math.random() * (subdivisions * 10 - depth));// each node contains:// its value, used by treemaps for layouting// its color, used by <MondrianRectangle> for the color// its children, recursively generated based on the number of childrenreturn {value,color: createColor({redRatio,yellowRatio,blueRatio,blackRatio,}),children:// this check helps us stop when we need to// d3.range generates an empty array of length N that we map over to create childrendepth < maxDepth * 5? d3.range(N).map(_ =>generateMondrian({value: value / N,depth: depth + 1,})): null,};};// kick off the recursive process with a value of 100return generateMondrian({value: 100,});// regenerate the base data when max depth or rate of subdivisions change}, [maxDepth, subdivisions]);// Iterate through all children and update colors when calledconst updateColors = node => ({...node,color: createColor({redRatio,yellowRatio,blueRatio,blackRatio,}),children: node.children ? node.children.map(updateColors) : null,});// useMemo again helps with stability// We update colors in our dataset whenever those ratios change// depending on subdivisions and maxDepth allows the data update from that earlier useMemo to propagatemondrian = useMemo(() => updateColors(mondrian), [redRatio,yellowRatio,blueRatio,blackRatio,subdivisions,maxDepth,]);return mondrian;}
And that creates mondrian datasets based on inputs. Now we just need the inputs.
Sliders for function inputs
Thanks to React Hooks, our sliders were pretty easy to implement. Each controls a ratio for a certain value fed into a random data generation method.
Take the slider that controls the ratio of red squares for example.
It starts life as a piece of state in the <App> component.
// src/App.jsconst [redRatio, setRedRatio] = useState(0.2);
redRatio is the value, setRedRatio is the value setter, 0.2 is the
initial value.
Render the slider as a <Range> component.
// src/App.js<Range name="red" value={redRatio} onChange={setRedRatio} />
Value comes from our state, update state on change.
The <Range> component itself looks like this:
// src/App.jsconst Range = ({ name, value, onChange }) => {return (<div style={ display: "inline-block" }>{name}<br /><inputtype="range"name={name}min={0}max={1}step={0.1}value={value}onChange={event => onChange(Number(event.target.value))}/></div>);};
HTML has built-in sliders so we don't have to reinvent the wheel. Render an
input, give it a type="range", set value from our prop, and parse the event
value in onChange before feeding it back to setRedRange with our callback.
Now each time you move that slider, it triggers a re-render, which generates a new Mondrian from the data.
Conclusion
In conclusion: generative art is hard, Piet Mondrian was brillianter than he seems, and D3 treemaps are great fun.
Hope you enjoyed this as much as I did :)
Cheers,
~Swizec