

A big example project - 176,113 tech salaries visualized
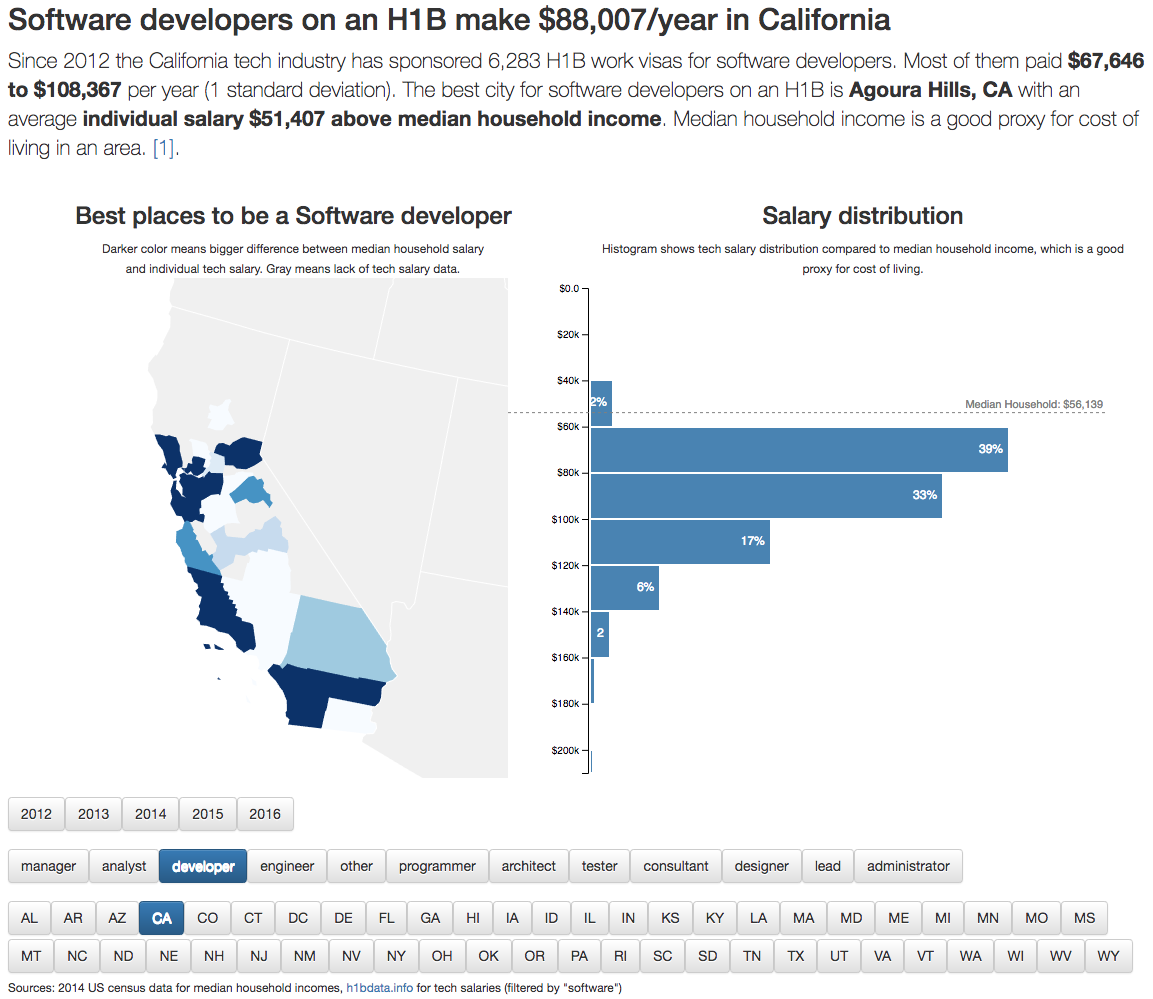
We're going to build this:
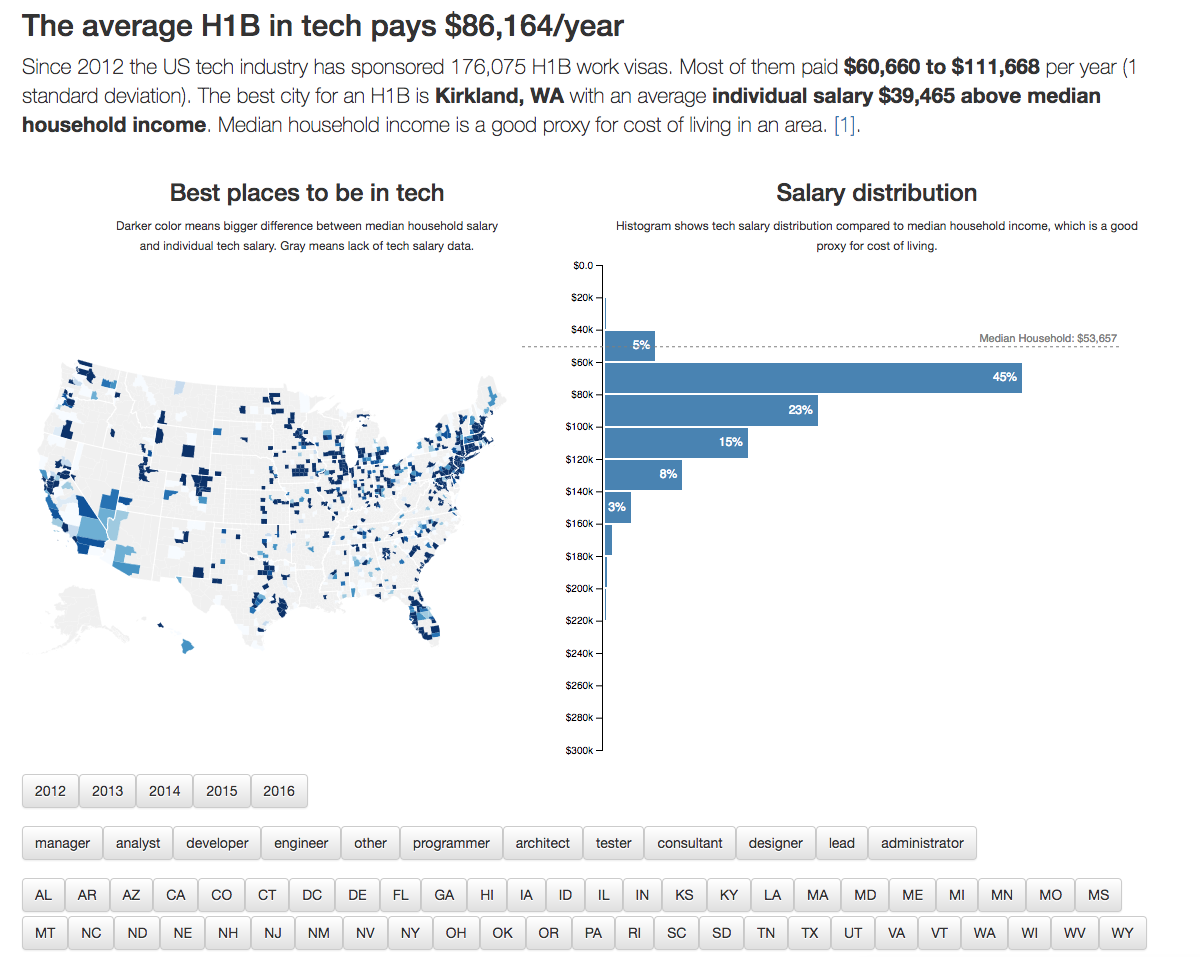
An interactive visualization dashboard app with a choropleth map and a histogram comparing tech salaries to median household income in the area. Users can filter by year, job title, or US state to get a better view.
It's going to be great.
At this point, I assume you've used create-react-app to set up your
environment. Check the
getting started
section if you haven't. I'm also assuming you've read the
building blocks chapter.
I'm still going to explain what we're doing, but knowing the basics helps.
I suggest you follow along, keep npm start running, and watch your
visualization change in real time as you code. It's rewarding as hell.
If you get stuck, you can use my
react-d3-walkthrough-livecode
to jump between steps. The
commits
correspond to the code at the end of each step. Check out the first commit and
run npm install to skip the initial setup.
If you want to see how this project evolved over 22 months, check the original repo. The modern-code branch has the code you're about to build.