

Asynchronously load data
Great! We have a preloader. Time to load some data.
We'll use D3's built-in data loading methods and tie their promises into React's component lifecycle. You could talk to a REST API in the same way. Neither D3 nor React care what the datasource is.
First, you need some data.
Our dataset comes from a few sources. Tech salaries are from h1bdata.info, median household incomes come from the US census data, and I got US geo map info from Mike Bostock's github repositories. Some elbow grease and python scripts tied them all together.
You can read about the scraping on my blog here, here, and here. But it's not the subject of this course.
Step 0: Get the data
Download the data files from
my walkthrough repository on Github.
Put them in your public/data directory.
Step 1: Prep App.js
Let's set up our App component first. That way you'll see results as soon
data loading starts to work.
Start by importing our data loading method - loadAllData - and both D3 and
Lodash. We'll need them later.
// src/App.jsimport React from "react"// Insert the line(s) between here...import * as d3 from "d3"import _ from "lodash"// ...and here.import Preloader from "./components/Preloader"// Insert the line(s) between here...import { loadAllData } from "./DataHandling"// ...and here.
You already know about default imports. Importing with {} is how we import
named exports. That lets us get multiple things from the same file. You'll see
the export side in Step 2.
Don't worry about the missing DataHandling file. It's coming soon.
// src/App.jsfunction App() {const [techSalaries, setTechSalaries] = useState([]);// Insert the line(s) between here...const [medianIncomes, setMedianIncomes] = useState([]);const [countyNames, setCountyNames] = useState([]);async function loadData() {const data = await loadAllData();const { techSalaries, medianIncomes, countyNames } = data;setTechSalaries(techSalaries);setMedianIncomes(medianIncomes);setCountyNames(countyNames);}useEffect(() => {loadData();}, []);// ...and here.
We initiate data loading inside the useEffect hook. It
fires when React first mounts our component into the DOM.
I like to tie data loading to component mounts because it means you aren't making requests you'll never use. In a bigger app, you'd use Redux, MobX, or similar to decouple loading from rendering. Many reasons why.
To load our data, we call the loadAllData function, then use state setters
in the callback. This updates App's state and triggers a re-render, which
updates our entire visualization via props.
We also add two more pieces of state: countyNames, and
medianIncomes. Defining what's in your component state in advance makes your
code easier to read. People, including you, know what to expect.
Let's change rendering to show a message when our data finishes loading.
// src/App.jsif (techSalaries.length < 1) {return <Preloader />} else {return (<div className="App container"><h1>Loaded {techSalaries.length} salaries</h1></div>)}
We added a container class to the main <div> and an <h1> tag that shows
how many datapoints there are. You can use any valid JavaScript in curly braces
{} and JSX will evaluate it. By convention we only use that ability to
calculate display values.
You should now get an error overlay.
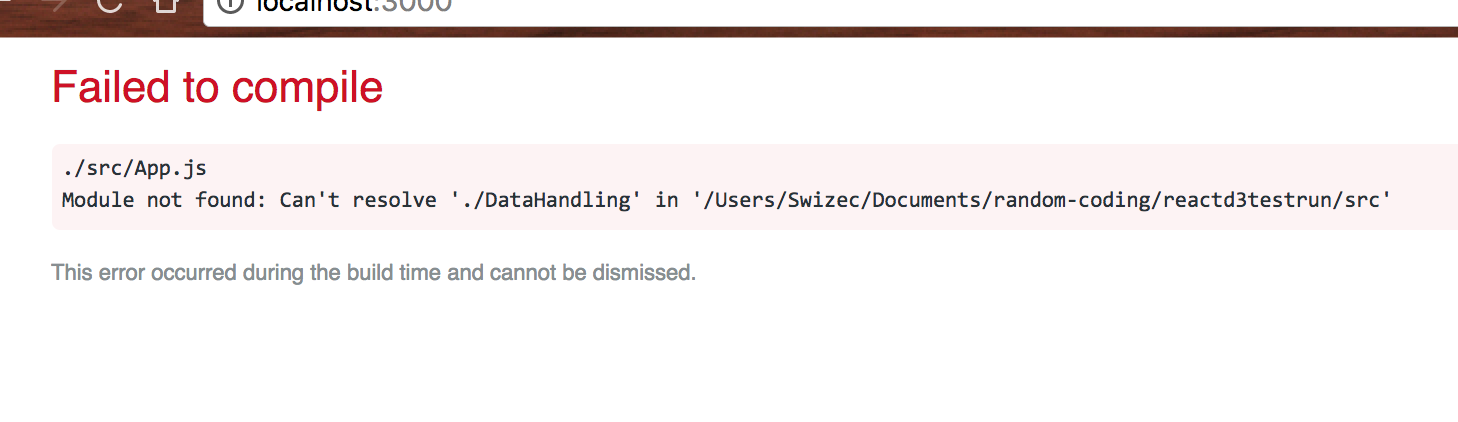
These nice error overlays come with create-react-app and make your code
easier to debug. No hunting around in the terminal to see compilation errors.
Let's build that file and fill it with our data loading logic.
Step 2: Prep data parsing functions
We're putting data loading logic in a separate file from App.js because it's
a bunch of functions that work together and don't have much to do with the
App component itself.
We start with two imports and four data parsing functions:
cleanIncome, which parses each row of household income datadateParse, which we use for parsing datescleanSalary, which parses each row of salary datacleanUSStateName, which parses US state names
// src/DataHandling.jsimport * as d3 from "d3"import _ from "lodash"const cleanIncome = (d) => ({countyName: d["Name"],USstate: d["State"],medianIncome: Number(d["Median Household Income"]),lowerBound: Number(d["90% CI Lower Bound"]),upperBound: Number(d["90% CI Upper Bound"]),})const dateParse = d3.timeParse("%m/%d/%Y")const cleanSalary = (d) => {if (!d["base salary"] || Number(d["base salary"]) > 300000) {return null}return {employer: d.employer,submit_date: dateParse(d["submit date"]),start_date: dateParse(d["start date"]),case_status: d["case status"],job_title: d["job title"],clean_job_title: d["job title"],base_salary: Number(d["base salary"]),city: d["city"],USstate: d["state"],county: d["county"],countyID: d["countyID"],}}const cleanUSStateName = (d) => ({code: d.code,id: Number(d.id),name: d.name,})const cleanCounty = (d) => ({id: Number(d.id),name: d.name,})
You'll see those d3 and lodash imports a lot.
Our data parsing functions all follow the same approach: Take a row of data as
d, return a dictionary with nicer key names, cast any numbers or dates into
appropriate formats. They all start as strings.
Doing all this parsing now, keeps the rest of our codebase clean. Handling data is always messy. You want to contain that mess as much as possible.
Step 3: Load the datasets
Now we can use D3 to load our data with fetch requests.
// src/DataHandling.jsexport const loadAllData = async () => {const datasets = await Promise.all([d3.json("data/us.json"),d3.csv("data/us-county-names-normalized.csv", cleanCounty),d3.csv("data/county-median-incomes.csv", cleanIncome),d3.csv("data/h1bs-2012-2016-shortened.csv", cleanSalary),d3.tsv("data/us-state-names.tsv", cleanUSStateName),]) //.then(([us, countyNames, medianIncomes, techSalaries, USstateNames]) => {})}
In version 5, D3 updated its data loading methods to use promises instead of
callbacks. You can load a single file using
d3.csv("filename").then(data => ..... The promise resolves with your data, or
throws an error.
Each d3.csv call makes a fetch request, parses the fetched CSV file into an
array of JavaScript dictionaries, and passes each row through the provided
cleanup function. We pass all median incomes through cleanIncome, salaries
through cleanSalary, etc.
To load multiple files, we use Promise.all with a list of unresolved
promises. Once resolved, our .then handler gets a list of results. We use
array destructuring to expand that list into our respective datasets before
running some more logic to tie them together.
D3 supports formats like json, csv, tsv, text, and xml out of the
box. You can make it work with custom data sources through the underlying
request API.
PS: we're using the shortened salary dataset to make page reloads faster while building our project.
Step 4: Tie the datasets together
If you add a console.log to the .then callback above, you'll see a bunch of
data. Each argument - us, countyNames, medianIncomes, techSalaries,
USstateNames - holds a parsed dataset from the corresponding file.
To tie them together and prepare a dictionary for setState back in the App
component, we need to add some logic. We're building a dictionary of county
household incomes and removing any empty salaries.
// src/DataHandling.jslet [us, countyNames, medianIncomes, techSalaries, USstateNames] = datasetslet medianIncomesMap = {};medianIncomes.filter(d => _.find(countyNames,{name: d['countyName']})).forEach((d) => {d['countyID'] = _.find(countyNames,{name: d['countyName']}).id;medianIncomesMap[d.countyID] = d;});techSalaries = techSalaries.filter(d => !_.isNull(d));return {usTopoJson: us,countyNames: countyNames,medianIncomes: medianIncomesMap,medianIncomesByCounty: _.groupBy(medianIncomes, 'countyName'),medianIncomesByUSState: _.groupBy(medianIncomes, 'USstate'),techSalaries: techSalaries,USstateNames: USstateNames}});
Building the income map looks weird because of indentation, but it's not that
bad. We filter the medianIncomes array to discard any incomes whose
countyName we can't find. I made sure they were all unique when I built the
datasets.
We walk through the filtered array with a forEach, find the correct
countyID, and add each entry to medianIncomesMap. When we're done, we have
a large dictionary that maps county ids to their household income data.
Then we filter techSalaries to remove any empty values where the
cleanSalaries function returned null. That happens when a salary is either
undefined or absurdly high.
When our data is ready, we call our callback with a dictionary of the new
datasets. To make future access quicker, we use _.groupBy to build dictionary
maps of counties by county name and by US state.
You should now see how many salary entries the shortened dataset contains.

If that didn't work, try comparing your changes to this diff on Github.