

Add user controls for data slicing and dicing
Now comes the fun part. All that extra effort we put into making our components aware of filtering, and it all comes down to this: User controls.
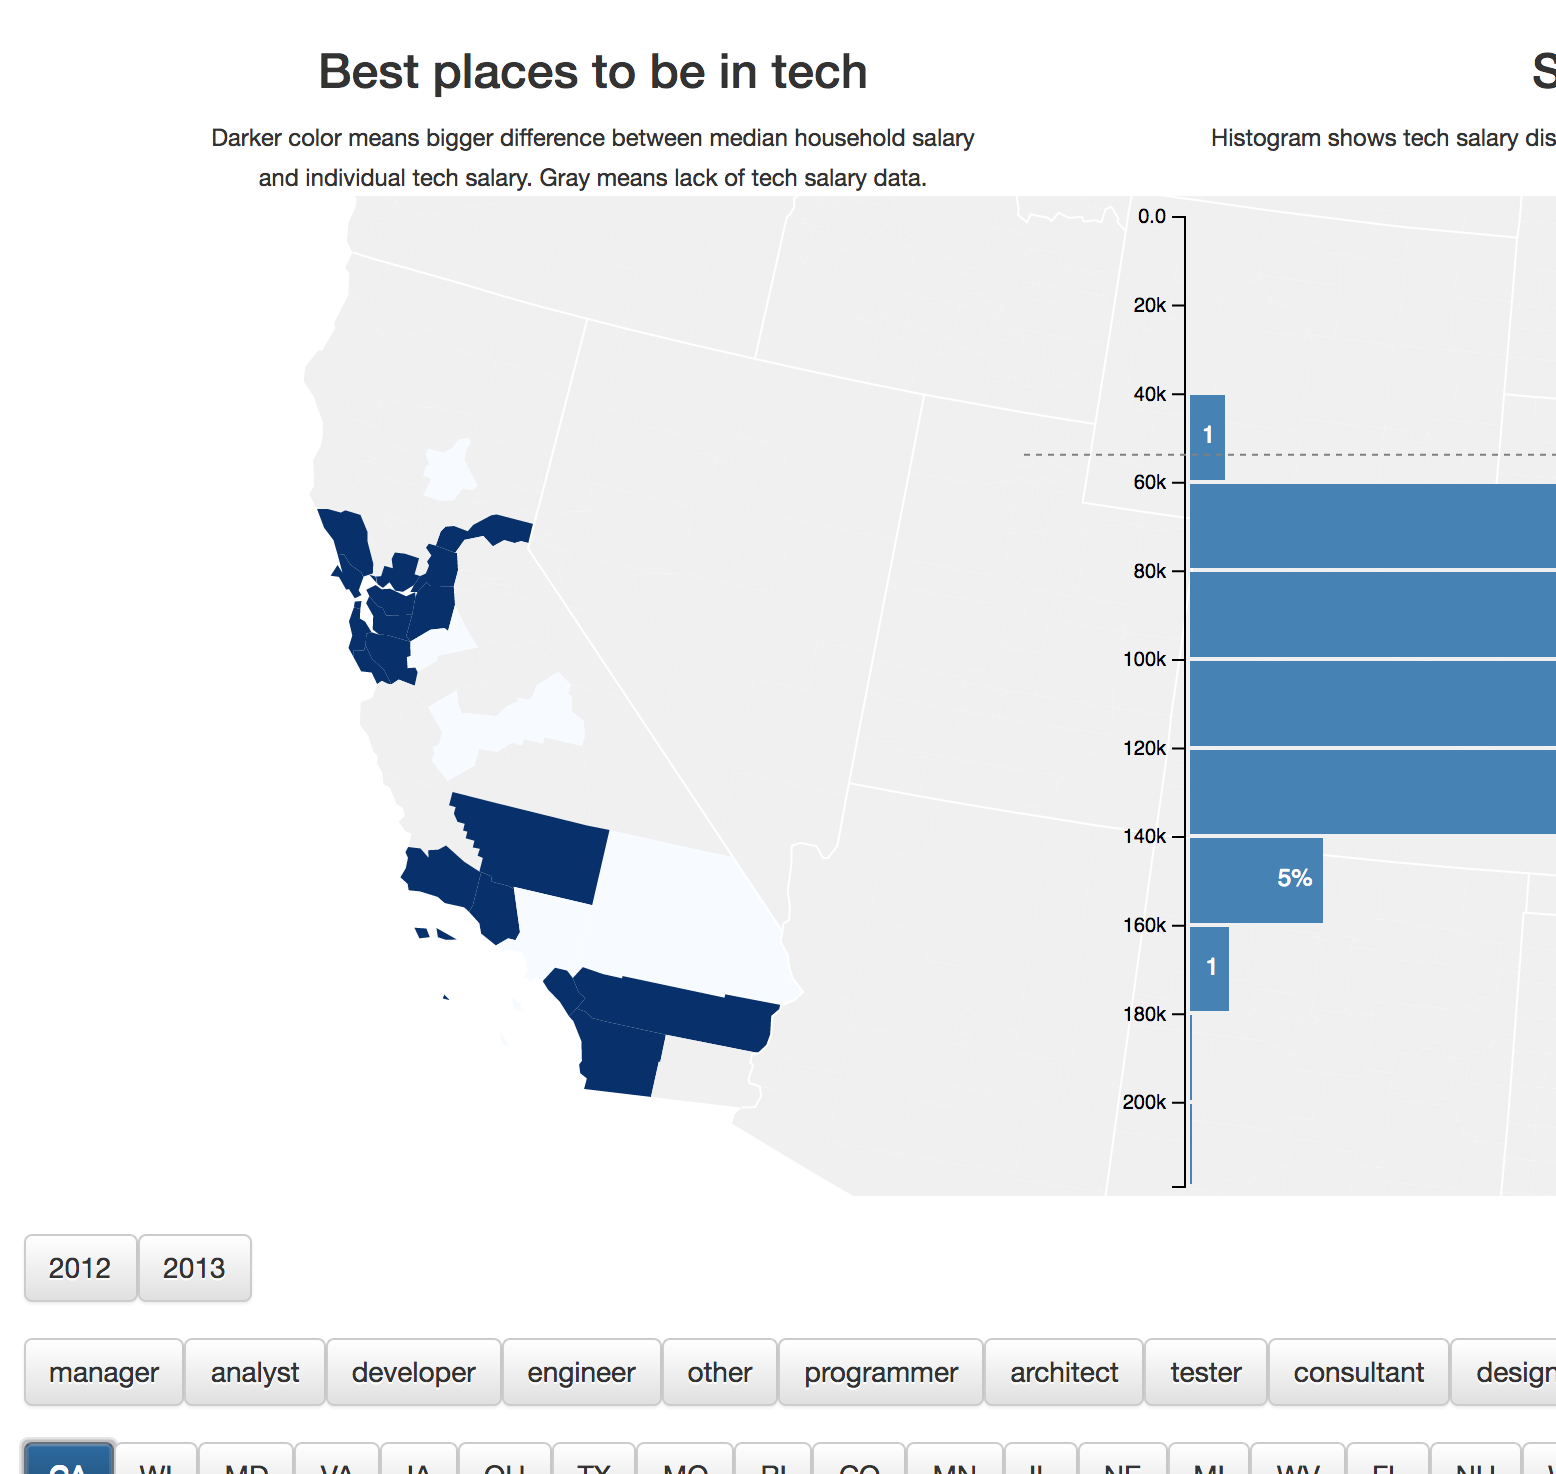
Here's what we're building:
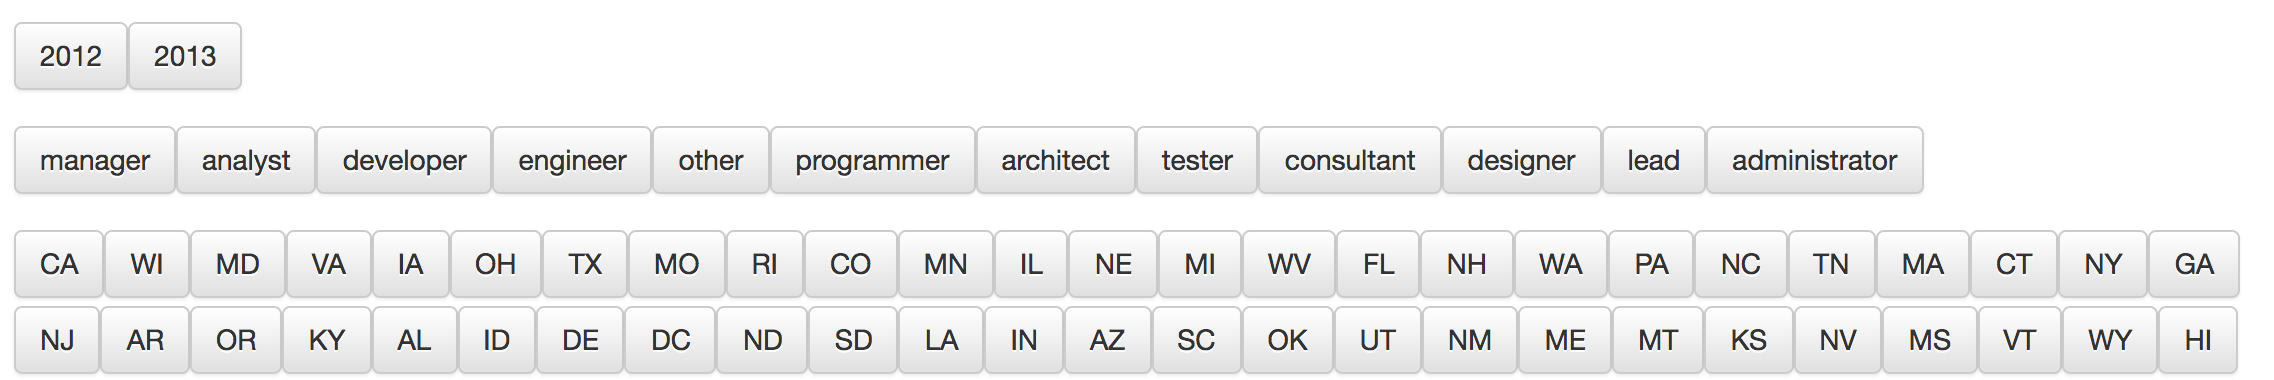
It's a set of filters for users to slice and dice our visualization. The shortened dataset gives you 2 years, 12 job titles, and 50 US states. You'll get 5+ years and many more job titles with the full dataset.
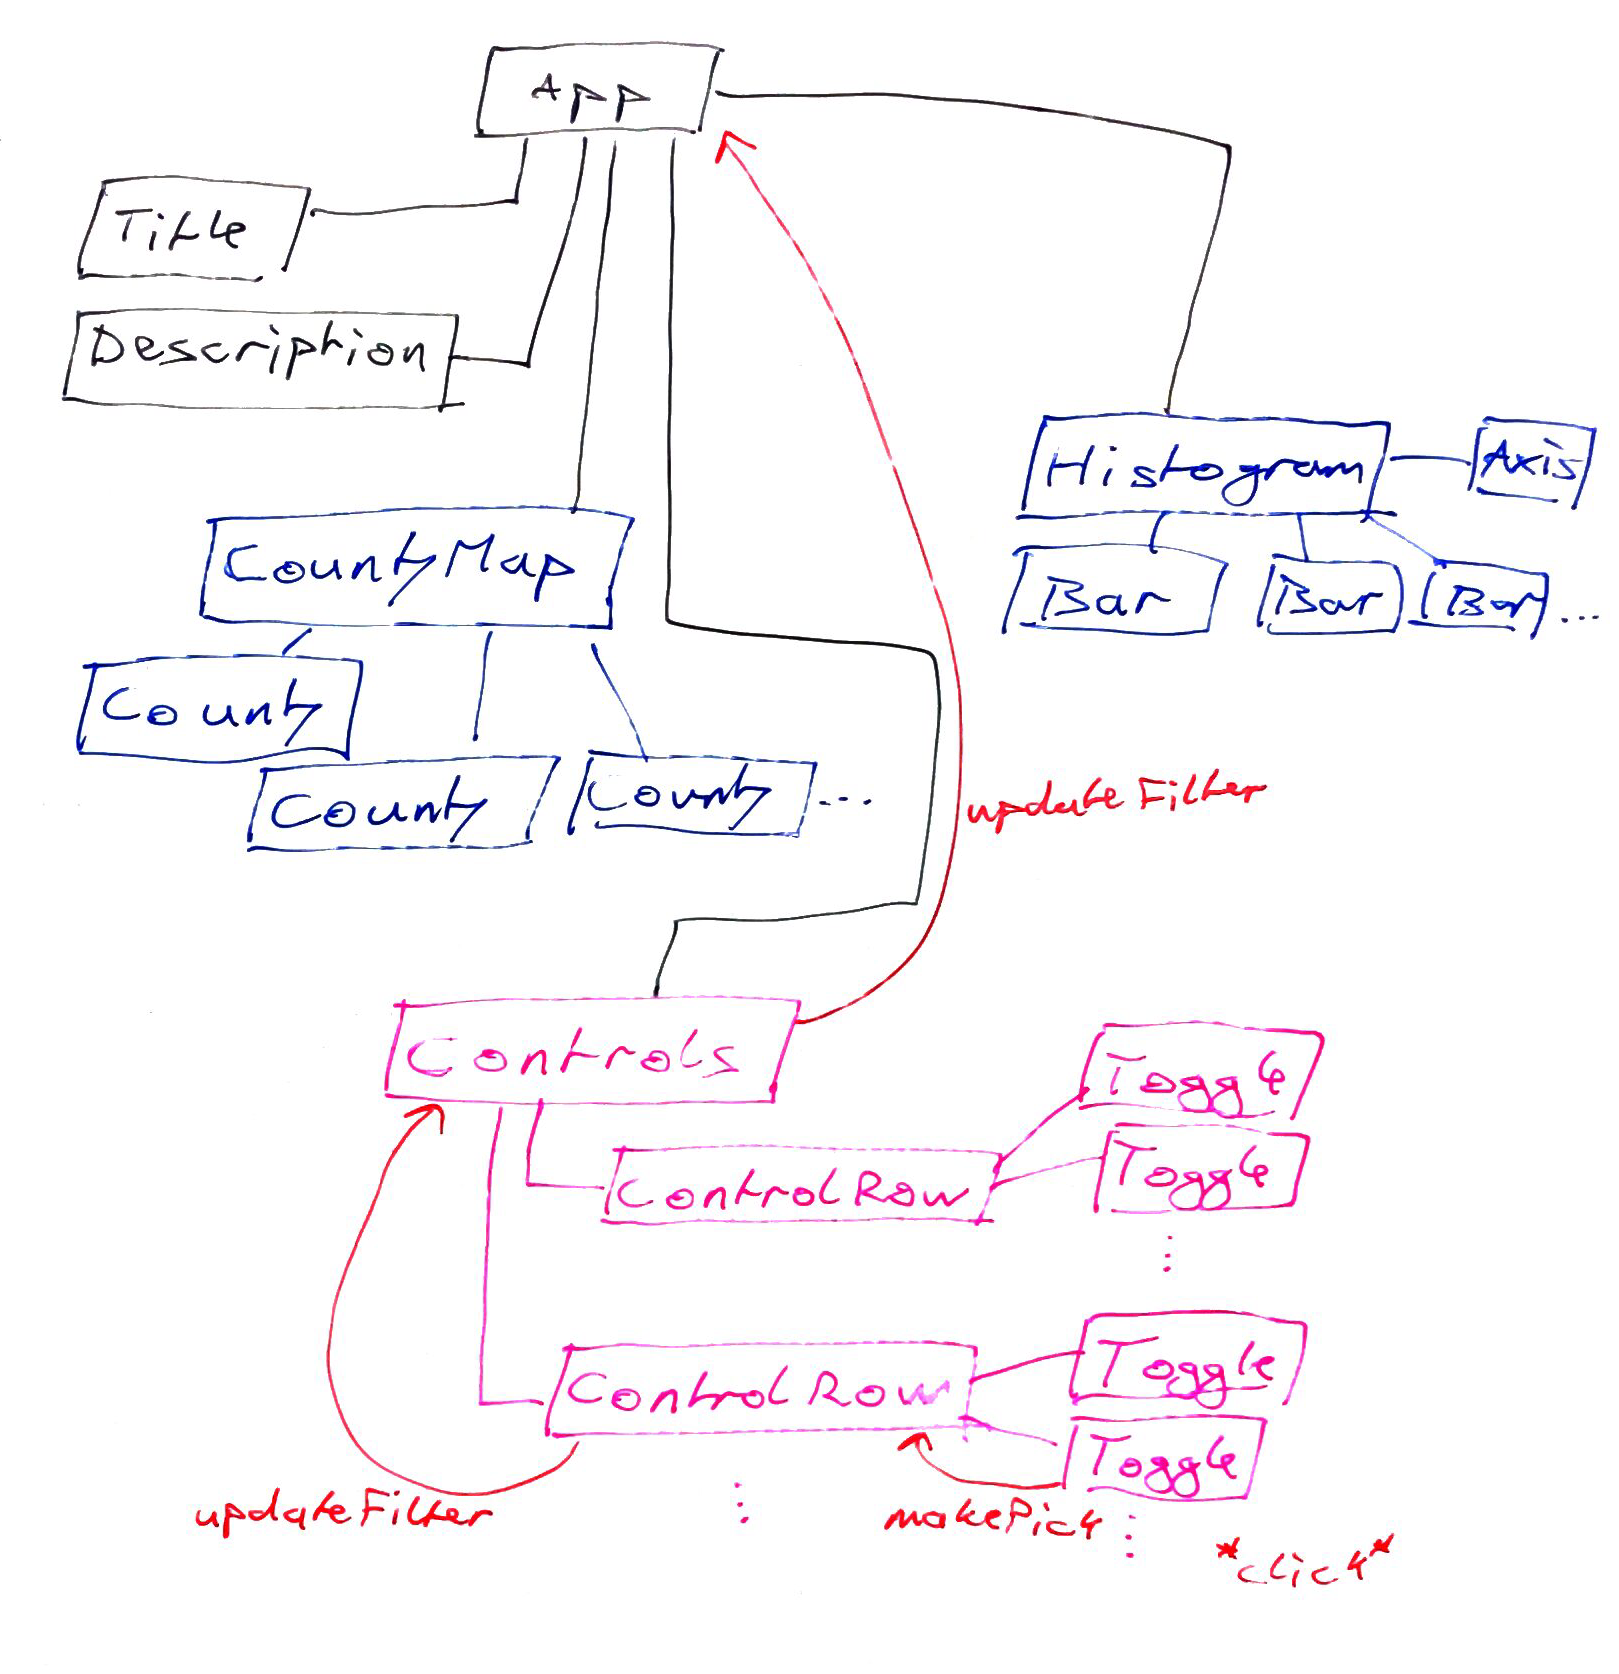
We're using the
architecture we discussed
earlier to make it work. Clicking buttons updates a filter function and
communicates it all the way up to the App component. App then uses it to
update this.state.filteredSalaries, which triggers a re-render and updates
our dataviz.
We're building controls in 4 steps, top to bottom:
- Update
App.jswith filtering and a<Controls>render - Build a
Controlscomponent, which builds the filter based on inputs - Build a
ControlRowcomponent, which handles a row of buttons - Build a
Togglecomponent, which is a button
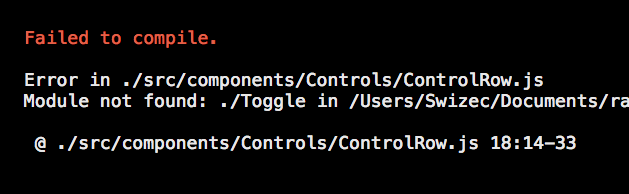
We'll go through the files linearly. That makes them easier for me to explain and easier for you to understand, but that also means there's going to be a long period where all you're seeing is an error like this:
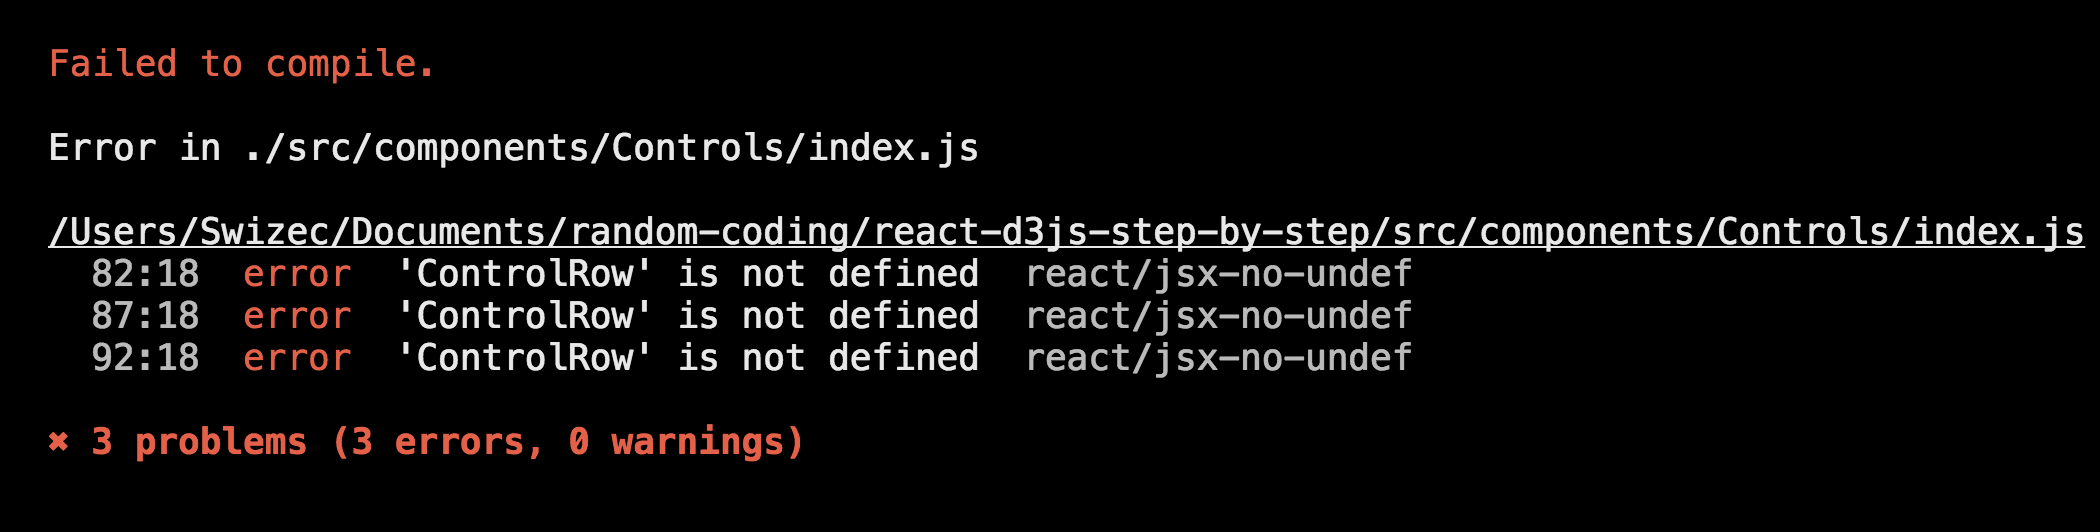
If you want to see what's up during this process, remove an import or two and
maybe a thing from render. For instance, it's complaining about ControlRow in
this screenshot. Remove the ControlRow import on top and delete
<ControlRow ... /> from render. The error goes away, and you see what you're
doing.
Step 1: Update App.js
All right, you know the drill. Add imports, tweak some things, add to render.
We have to import Controls, set up filtering, update the map's zoom prop,
and render a white rectangle and Controls.
The white rectangle makes it so the zoomed-in map doesn't cover up the histogram. I'll explain when we get there.
// src/App.jsimport MedianLine from "./components/MedianLine"// Insert the line(s) between here...import Controls from "./components/Controls"// ...and here.class App extends React.Component {// Insert the line(s) between here...const [salariesFilter, setSalariesFilter] = useState(() => () => true);// ...and here.const [filteredBy, setFilteredBy] = useState({USstate: "*",year: "*",jobTitle: "*",});// ...// Insert the line(s) between here...function updateDataFilter(filter, filteredBy) {setFilteredBy(filteredBy);setSalariesFilter(() => filter);}// ...and here.render() {// ...}}
We import the Controls component and add a default salariesFilter function
to this.state. The updateDataFilter method passes the filter function and
filteredBy dictionary from arguments to App state. We'll use it as a callback
in Controls.
The rest of filtering setup happens in the render method.
// src/App.jsfunction App() {// ...// ...// Delete the line(s) between here...const filteredSalaries = techSalaries// ...and here.// Insert the line(s) between here...const filteredSalaries = techSalaries.filter(salariesFilter)// ...and here.// ...let zoom = null,medianHousehold = // ...// Insert the line(s) between here...if (filteredBy.USstate !== "*") {zoom = filteredBy.USstate;medianHousehold = d3.mean(medianIncomesByUSState[zoom],(d) => d.medianIncome);}// ...and here.// ...}}
We add a .filter call to filteredSalaries, which uses our salariesFilter
method to throw out anything that doesn't fit. Then we set up zoom, if a US
state was selected.
We built the CountyMap component to focus on a given US state. Finding the
centroid of a polygon, re-centering the map, and increasing the sizing factor.
It creates a nice zoom effect.
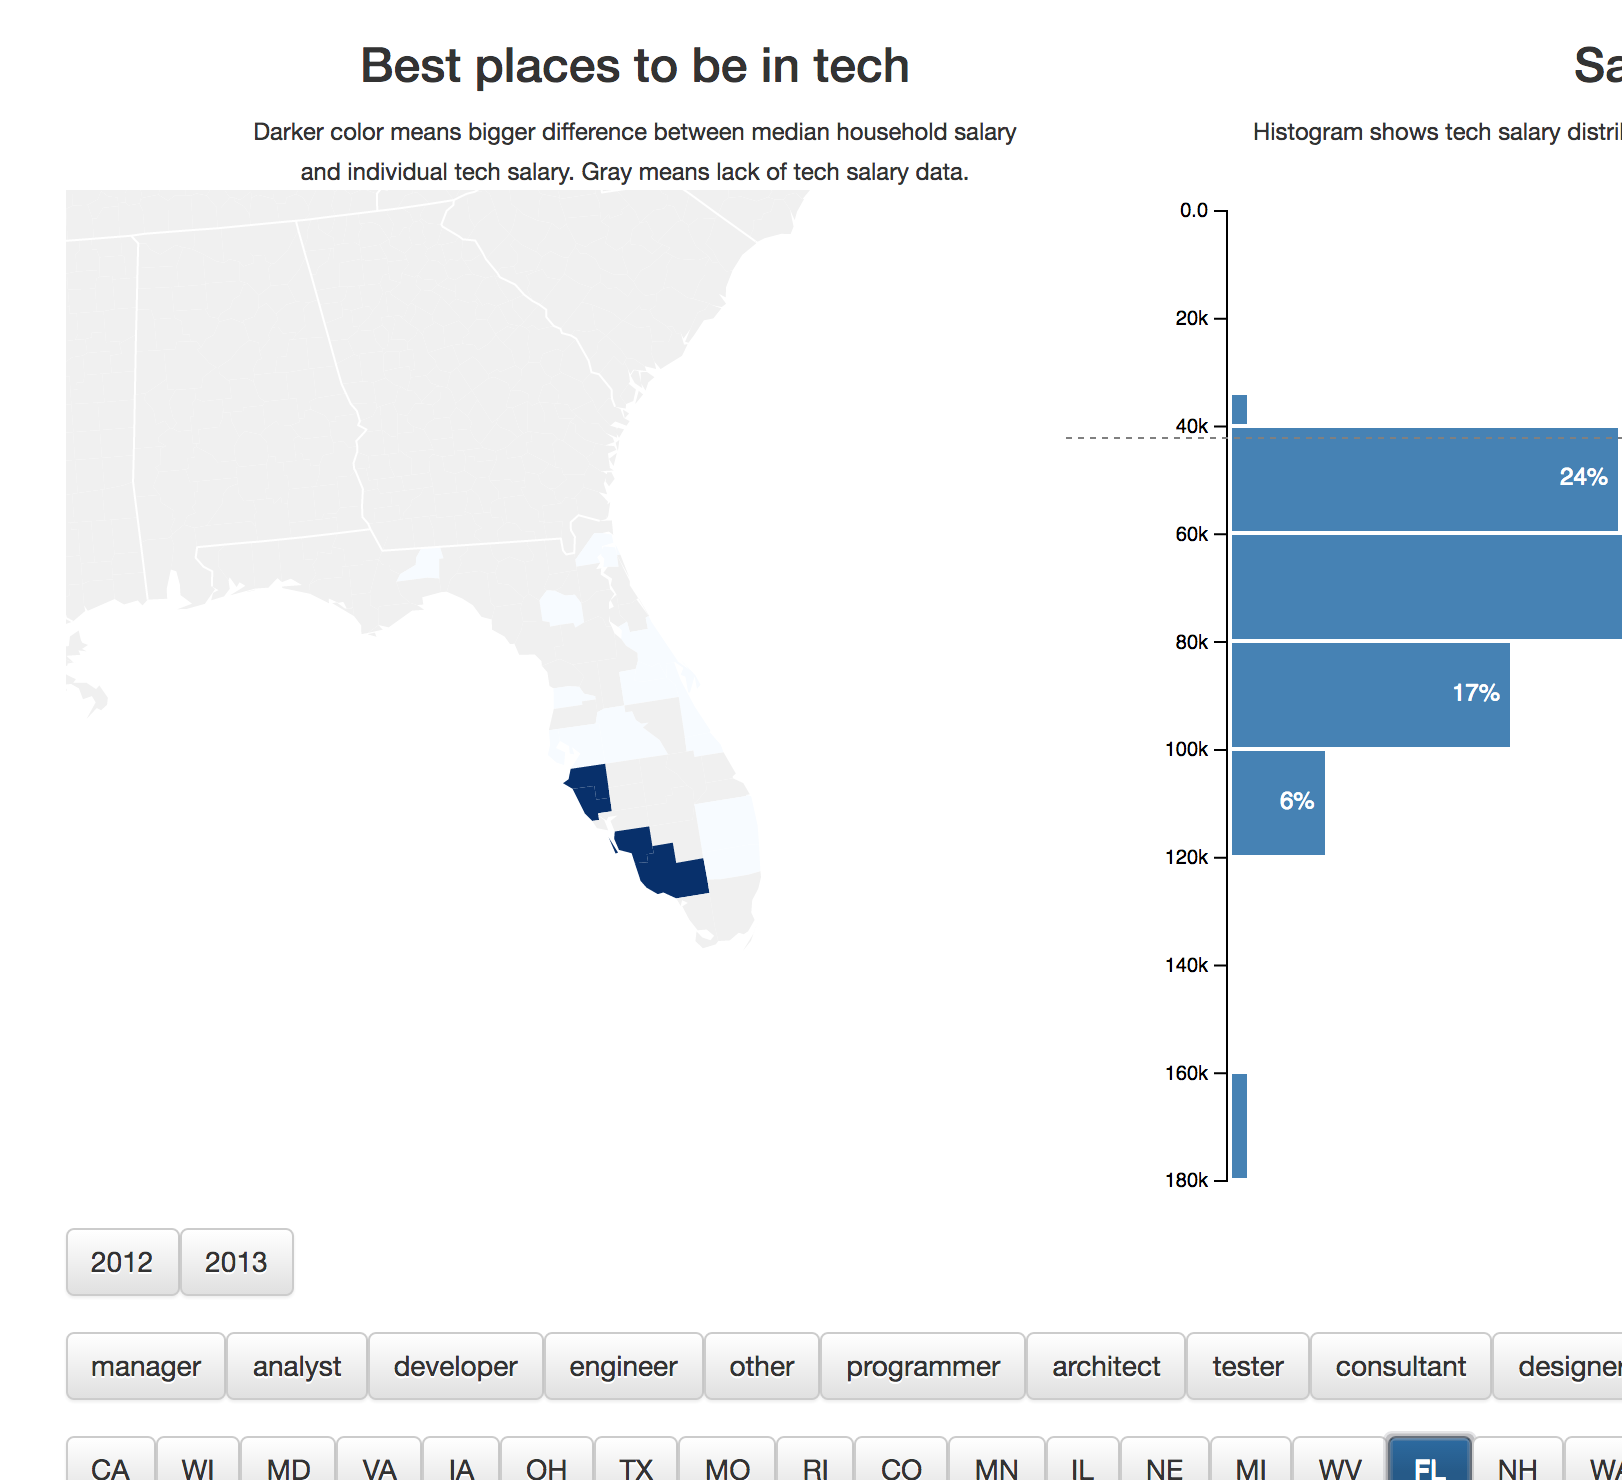
And here's the downside of this approach. SVG doesn't know about element boundaries. It just renders stuff.
See, it goes under the histogram. Let's fix that and add the Controls render
while we're at it.
// src/App.jsfunction App() {// ...// ...return (<div //...><svg //...><CountyMap //... />// Insert the line(s) between here...<rect x="500" y="0"width="600"height="500"style={{fill: 'white'}} />// ...and here.<Histogram //... /><MedianLine //.. /></svg>// Insert the line(s) between here...<Controls data={techSalaries}updateDataFilter={updateDataFilter} />// ...and here.</div>)}}
Rectangle, 500 to the right, 0 from top, 600 wide and 500 tall, with a
white background. Gives the histogram an opaque background, so it doesn't
matter what the map is doing.
We render the Controls component just after </svg> because it's not an SVG
component – it uses normal HTML. Unlike other components, it needs our entire
dataset as data. We use the updateDataFilter prop to say which callback
function it should call when a new filter is ready.
If this seems roundabout ... I've seen worse. The callbacks approach makes our
app easier to componentize and keeps the code relatively unmessy. Imagine
putting everything we've done so far in App! :satisfied:
Step 2: Build Controls component
The Controls component builds our filter function and filteredBy dictionary
based on user choices.
Controls renders 3 rows of buttons and builds filtering out of the choice
made on each row. That makes Controls kind of repetitive, but that's okay.
To keep this book shorter, we're going to build everything for a year filter
first. Then I'll explain how to add USstate and jobTitle filters on a
higher level. Once you have one working, the rest follows that same pattern.
Make a Controls directory in src/components/ and let's begin. The main
Controls component goes in your index.js file.
Stub Controls
// src/components/Controls.jsimport React from "react"import ControlRow from "./ControlRow"const Controls = ({ data, updateDataFilter }) => {const [filteredBy, setFilteredBy] = useState({year: "*",})const [filterFunctions, setFilter] = useState({year: () => true,})const updateYearFilter = (year, reset) => {}}export default Controls
We start with some imports and a Controls class-based component. Inside, we
define default state with an always-true yearFilter and an asterisk for
year.
We also need an updateYearFilter function, which we'll use to update the
filter, a reportUpdateUpTheChain function, and a render method. We're using
reportUpdateUpTheChain to bubble updates to our parent component. It's a
simpler alternative to using React Context or a state management library.
Filter logic
// src/components/Controls.jsconst Controls = (...) => {// ...const updateYearFilter = (year, reset) => {let yearFilter = (d) => d.submit_date.getFullYear() === yearif (reset || !year) {yearFilter = () => trueyear = "*"}setFilteredBy((filteredBy) => {return { ...filteredBy, year }})setFilter((filterFunctions) => {return { ...filterFunctions, year: yearFilter }})}}
updateYearFilter is a callback we pass into ControlRow. When a user picks a
year, their action triggers this function.
When that happens, we create a new partial filter function. The App component
uses it inside a .filter call like you saw earlier. We have to return true
for elements we want to keep and false for elements we don't.
Comparing submit_date.getFullYear() with year achieves that.
The reset argument lets us reset filters back to defaults. Enables users to
unselect options.
When we have the year and filter, we update component state with
this.setState. This triggers a re-render and calls reportUpdateUpTheChain
afterwards. Great use-case for the little known setState callback 😃
reportUpdateUpTheChain then calls this.props.updateDataFilter, which is a
callback method on App. We defined it earlier – it needs a new filter method
and a filteredBy dictionary.
// src/components/Controls.jsconst Controls = ( ... ) => {// ...function reportUpdateUpTheChain() {window.location.hash = [filteredBy.year].join("-");const filter = (d) =>filterFunctions.year(d)updateDataFilter(filter, filteredBy);}}
Building the filter method looks tricky because we're composing multiple
functions. The new arrow function takes a dictionary of filters as an argument
and returns a new function that &&s them all. We invoke it immediately with
this.state as the argument.
It looks silly when there's just one filter, but I promise it makes sense.
Render
Great, we have the filter logic. Let's render those rows of controls we've been talking about.
// src/components/Controls/index.jsconst Controls = (...) => {// ...const years = new Set(data.map((d) => d.submit_date.getFullYear()));return (<div><ControlRowdata={data}toggleNames={Array.from(years.values())}picked={filteredBy.year}updateDataFilter={updateYearFilter}/></div>)}
Once more, this is generalized code used for a single example: the year
filter.
We build a Set of distinct years in our dataset, then render a ControlRow
using props to give it our data, a set of toggleNames, a callback to update
the filter, and which entry is picked right now. Also known as the controlled
component pattern, it enables us to maintain the data-flows-down,
events-bubble-up architecture.
If you don't know about Sets, they're an ES6 data structure that ensures
every entry is unique. Just like a mathematical set. They're pretty fast.
Step 3: Build ControlRow component
Let's build the ControlRow component. It renders a row of controls and
ensures only one at a time is selected.
We'll start with a stub and go from there.
// src/components/Controls.jsimport React from "react"const ControlRow = ({data,toggleNames,picked,updateDataFilter,capitalize,}) => {function makePick(picked, newState) {updateDataFilter(picked, !newState)}}
makePick calls the data filter update and passes in the new value and whether
we want to unselect. Pretty simple right?
// src/components/Controls.jsconst ControlRow = () => {// ...return (<div className="row"><div className="col-md-12">{toggleNames.map((name) => (<Togglelabel={capitalize ? name.toUpperCase() : name}name={name}key={name}value={picked === name}onClick={makePick}/>))}</div></div>)}
In render, we set up two divs with Bootstrap classes. The first is a row,
and the second is a full-width column. I tried using a column for each button,
but it was annoying to manage and used too much space.
Inside the divs, we map over all toggles and use the <Toggle> component to render each of them. The label is a prettier version of the name, which
also serves as a key in our toggleValues dictionary. It's going to be the
picked attribute in makePick.
Your browser should continue showing an error, but it should change to talking
about the Toggle component instead of ControlRow.
Let's build it.
Step 5: Add US state and Job Title filters
With all that done, we can add two more filters: US states and job titles. Our
App component is already set up to use them, so we just have to add them to
the Controls component.
We'll start with the render method, then handle the parts I said earlier
would look repetitive.
// src/components/Controls.jsconst Controls = () => {// ...const years = new Set(data.map((d) => d.submit_date.getFullYear())),// Insert the line(s) between here...jobTitles = new Set(data.map((d) => d.clean_job_title)),USstates = new Set(data.map((d) => d.USstate))// ...and here.return (<div><ControlRowdata={data}toggleNames={Array.from(years.values())}picked={this.state.year}updateDataFilter={this.updateYearFilter}/>// Insert the line(s) between here...<ControlRowdata={data}toggleNames={Array.from(jobTitles.values())}picked={this.state.jobTitle}updateDataFilter={this.updateJobTitleFilter}/><ControlRowdata={data}toggleNames={Array.from(USstates.values())}picked={this.state.USstate}updateDataFilter={this.updateUSstateFilter}capitalize="true"/>// ...and here.</div>)}}
Ok, this part is plenty repetitive, too.
We created new sets for jobTitles and USstates, then rendered two more
ControlRow elements with appropriate attributes. They get toggleNames for
building the buttons, picked to know which is active, an updateDataFilter
callback, and we tell US states to render capitalized.
The implementations of those updateDataFilter callbacks follow the same
pattern as updateYearFilter.
// src/components/Controls.jsconst Controls = () => {const [filteredBy, setFilteredBy] = useState({year: "*",USstate: "*",jobTitle: "*",})const [filterFunctions, setFilter] = useState({year: () => true,USstate: () => true,jobTitle: () => true,})const updateJobTitleFilter = (jobTitle, reset) => {let jobTitleFilter = (d) => d.clean_job_title === jobTitleif (reset || !jobTitle) {jobTitleFilter = () => truejobTitle = "*"}setFilteredBy((filteredBy) => {return { ...filteredBy, jobTitle }})setFilter((filterFunctions) => {return { ...filterFunctions, jobTitle: jobTitleFilter }})reportUpdateUpTheChain()}const updateUSstateFilter = (USstate, reset) => {let USstateFilter = (d) => d.clean_job_title === USstateif (reset || !USstate) {USstateFilter = () => trueUSstate = "*"}setFilteredBy((filteredBy) => {return { ...filteredBy, USstate }})setFilter((filterFunctions) => {return { ...filterFunctions, USstate: USstateFilter }})reportUpdateUpTheChain()}// ..}export default Controls
Yes, they're basically the same as updateYearFilter. The only difference is a
changed filter function and using different keys when setting state.
Why separate functions then? No need to get fancy. It would've made the code harder to read.
Our last step is to add these new keys to the reportUpdateUpTheChain
function.
// src/components/Controls/index.jsconst Controls = () => {function reportUpdateUpTheChain() {window.location.hash = [filteredBy.year,filteredBy.USstate,filteredBy.jobTitle,].join("-")const filter = (d) =>filterFunctions.year(d) &&filterFunctions.USstate(d) &&filterFunctions.jobTitle(d)updateDataFilter(filter, filteredBy)}}
We add them to the filter condition with && and expand the filteredBy
argument.
Two more rows of filters show up.
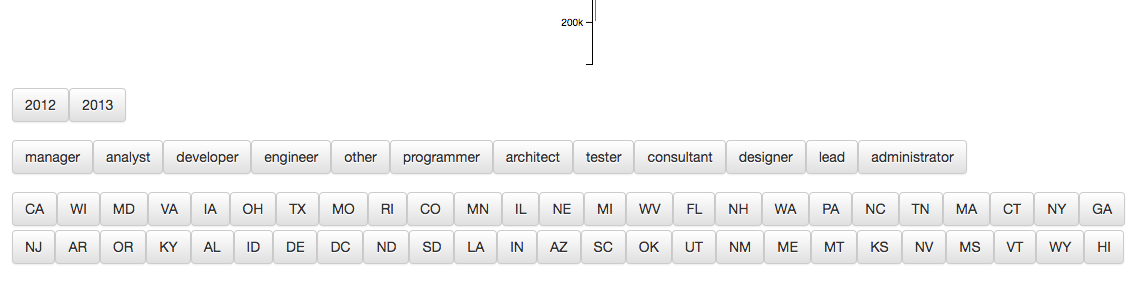
👏
Stale state is stale 🤨
A funny thing happened. We were calling reportUpdateUpTheChain which relies on local state in the component.
But that state doesn't update right away. And the state hook provides no callback like the old this.setState used to.
reportUpdateUpTheChain is a side-effect! We have to use useEffect.
// src/components/Controls.jsconst Controls = ({ data, updateDataFilter }) => {useEffect(() => {reportUpdateUpTheChain()}, [filteredBy, filterFunctions])}
You should now have a working data visualization dashboard with user controls. It struggles on certain clicks because of the shortened dataset.
If that didn't work, consult the diff on GitHub
Next up - going live 🚀